

Your graphics add a nice touch to my presentations and I recently used them for one of my all-hands meetings. Your toolbox adds professionalism to my slides. Instead of using standard clipart.
Claude Jones, Director of Engineer, @Walmartlabs, USA

Your graphics add a nice touch to my presentations and I recently used them for one of my all-hands meetings. Your toolbox adds professionalism to my slides. Instead of using standard clipart.
Claude Jones, Director of Engineer, @Walmartlabs, USA
I needed a fresh look at some of my slides. I've tried to find a way to create a paintbrush effect, to underline, accentuate, add some color and the handwritten markers were just the things. Very easy to use, easy to size, change the color. It was an affordable, perfect solution and I'm happy to recommend it.
Anonymous, US
The crisp, clean look of the graphics, and the fact that it allowed me to easily edit and change the colors to match the template was my main reason for purchasing them.
Brandie Jenkins, E-learning Developer, USA
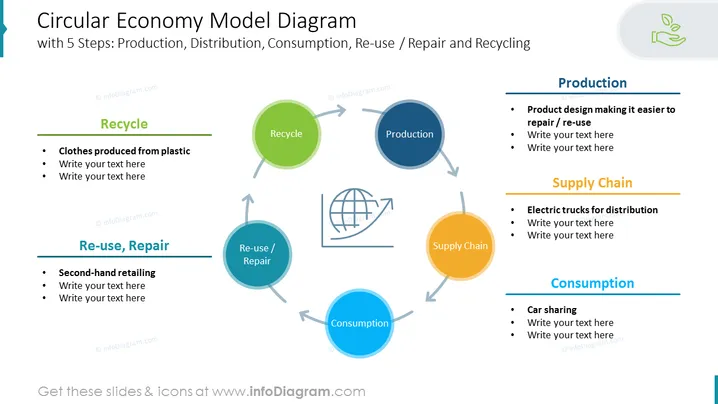
Die PowerPoint-Folie präsentiert das "Diagramm des Modells der circularen Wirtschaft", das in fünf Schritten dargestellt ist: Produktion, Verteilung, Konsum, Wiederverwendung / Reparatur und Recycling. Jeder dieser Schritte wird durch ein farblich gestaltetes kreisförmiges Symbol repräsentiert, das eine benachbarte Textbox für zusätzliche Informationen hat. "Produktion" deutet auf ein Produktdesign hin, das reparatur- oder wiederverwendungsfreundlicher ist. "Verteilung" wird durch elektrische Lastwagen für die Distribution veranschaulicht, was die Berücksichtigung von Nachhaltigkeit zeigt. "Konsum" führt Carsharing als Konsummodell ein. "Wiederverwendung / Reparatur" umfasst den Einzelhandel mit Second-Hand-Waren und fördert die Idee, den Lebenszyklus von Gütern zu verlängern. Schließlich beinhaltet "Recycling" ein Beispiel für Kleidung, die aus Kunststoff hergestellt wird, und hebt die Umwandlung von Abfall in nützliche Produkte hervor.



