

Your graphics add a nice touch to my presentations and I recently used them for one of my all-hands meetings. Your toolbox adds professionalism to my slides. Instead of using standard clipart.
Claude Jones, Director of Engineer, @Walmartlabs, USA

Your graphics add a nice touch to my presentations and I recently used them for one of my all-hands meetings. Your toolbox adds professionalism to my slides. Instead of using standard clipart.
Claude Jones, Director of Engineer, @Walmartlabs, USA
I needed a fresh look at some of my slides. I've tried to find a way to create a paintbrush effect, to underline, accentuate, add some color and the handwritten markers were just the things. Very easy to use, easy to size, change the color. It was an affordable, perfect solution and I'm happy to recommend it.
Anonymous, US
The crisp, clean look of the graphics, and the fact that it allowed me to easily edit and change the colors to match the template was my main reason for purchasing them.
Brandie Jenkins, E-learning Developer, USA
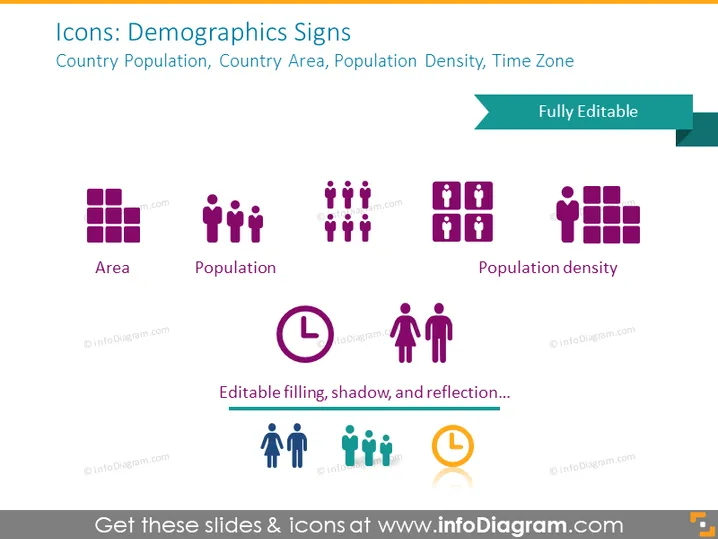
Die Folie mit dem Titel "Icons: Demographics Signs" enthält grafische Darstellungen für demografische Kennzahlen: Fläche, Bevölkerung und Bevölkerungsdichte. "Fläche" wird durch ein Gitter aus Quadraten symbolisiert, das Land oder geografische Maße darstellt. "Bevölkerung" wird mit einer Gruppe von menschlichen Figuren dargestellt, die die Anzahl der Individuen innerhalb einer demografischen Gruppe anzeigt. "Bevölkerungsdichte" kombiniert das Gitter und die Figuren, um die Konzentration von Menschen in einem Gebiet zu veranschaulichen. Ein Merkmal dieser Icons umfasst "Bearbeitbare Füllung, Schatten und Reflexion..."
Die Folie hat eine moderne und klare Designästhetik, mit einem einheitlichen Farbschema und Icons, die stilistisch einheitlich sind. Die Verwendung von Schatten und Reflexionen unter den Icons vermittelt ein Gefühl von Raffinesse und einem leichten dreidimensionalen Erscheinungsbild.



