

Your graphics add a nice touch to my presentations and I recently used them for one of my all-hands meetings. Your toolbox adds professionalism to my slides. Instead of using standard clipart.
Claude Jones, Director of Engineer, @Walmartlabs, USA

Your graphics add a nice touch to my presentations and I recently used them for one of my all-hands meetings. Your toolbox adds professionalism to my slides. Instead of using standard clipart.
Claude Jones, Director of Engineer, @Walmartlabs, USA
I needed a fresh look at some of my slides. I've tried to find a way to create a paintbrush effect, to underline, accentuate, add some color and the handwritten markers were just the things. Very easy to use, easy to size, change the color. It was an affordable, perfect solution and I'm happy to recommend it.
Anonymous, US
The crisp, clean look of the graphics, and the fact that it allowed me to easily edit and change the colors to match the template was my main reason for purchasing them.
Brandie Jenkins, E-learning Developer, USA
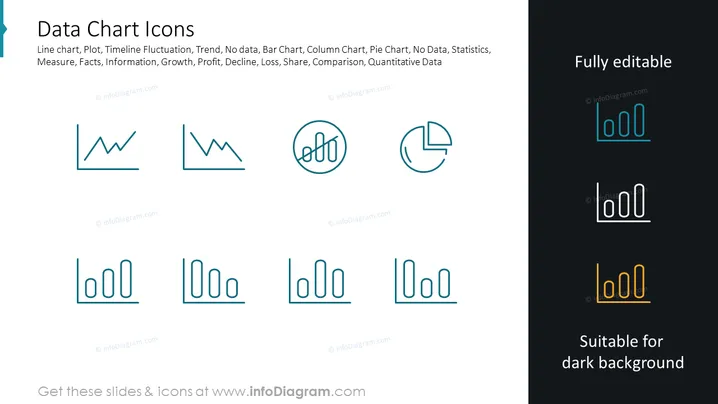
Die Folie mit dem Titel "Datenchart-Icons" präsentiert eine Sammlung stilisierter Symbole, die verschiedene Typen von Diagrammen darstellen, die typischerweise in der Datenanalyse verwendet werden. Diese Icons beinhalten Darstellungen eines Liniendiagramms, Säulendiagramms und Kreisdiagramms, die Funktionen wie Trendanalyse, statistischen Vergleich und Datensegmentierung suggerieren. Jedes Icon symbolisiert eine spezifische Methode der Datenvisualisierung: das Liniendiagramm für Trends und Schwankungen, das Säulendiagramm für vergleichende Messungen und das Kreisdiagramm für proportionale Datenverteilung.
Die Folie hat ein modernes und professionelles Aussehen mit einer konsistenten Farbpalette. Der Einsatz des flachen Designs für die Icons gewährleistet eine klare und einfache visuelle Kommunikation der Datenkonzepte.



