
Your graphics add a nice touch to my presentations and I recently used them for one of my all-hands meetings. Your toolbox adds professionalism to my slides. Instead of using standard clipart.
Claude Jones, Director of Engineer, @Walmartlabs, USA
Your graphics add a nice touch to my presentations and I recently used them for one of my all-hands meetings. Your toolbox adds professionalism to my slides. Instead of using standard clipart.
Claude Jones, Director of Engineer, @Walmartlabs, USA
I needed a fresh look at some of my slides. I've tried to find a way to create a paintbrush effect, to underline, accentuate, add some color and the handwritten markers were just the things. Very easy to use, easy to size, change the color. It was an affordable, perfect solution and I'm happy to recommend it.
Anonymous, US
The crisp, clean look of the graphics, and the fact that it allowed me to easily edit and change the colors to match the template was my main reason for purchasing them.
Brandie Jenkins, E-learning Developer, USA
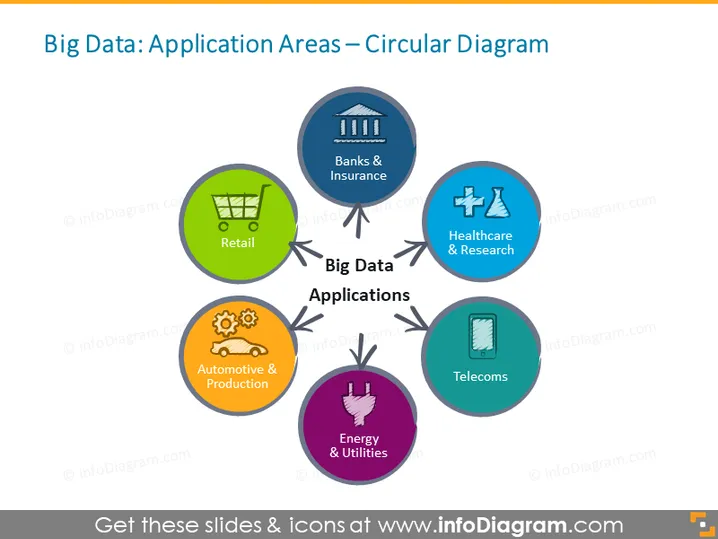
Die Folie veranschaulicht die Anwendungsbereiche von Big Data, die in einem Kreisdiagramm-Format dargestellt sind. Es beschreibt sechs Sektoren, darunter "Banken & Versicherungen", symbolisiert durch ein Banksymbol, das die Nutzung von Big Data in Finanzdienstleistungen zur Risikobewertung und Kundenpersonalisierung signifiziert. "Gesundheitswesen & Forschung", dargestellt mit einem Mikroskopsymbol, hebt die Rolle von Big Data bei der Förderung medizinischer Forschung und Patientenversorgung hervor. "Telekommunikation", angezeigt mit einem Mobiltelefonsymbol, wo Big Data bei der Netzwerkoptimierung und Verbesserung des Kundenservices hilft. "Energie & Versorgungsunternehmen", dargestellt mit einem Hand-Symbol, das eine Glühbirne hält, konzentriert sich darauf, wie Big Data das Management von Smart Grids und vorausschauende Wartung erleichtert. "Automotive & Produktion", mit einem Zahnrad-Symbol, repräsentiert die Integration von Big Data in die Automobilproduktion für Effizienz und Automatisierung. Schließlich veranschaulicht "Einzelhandel", markiert durch ein Einkaufswagensymbol, die Verwendung von Big Data zur Analyse des Verbraucherverhaltens und des Bestandsmanagements.




