

Your graphics add a nice touch to my presentations and I recently used them for one of my all-hands meetings. Your toolbox adds professionalism to my slides. Instead of using standard clipart.
Claude Jones, Director of Engineer, @Walmartlabs, USA

Your graphics add a nice touch to my presentations and I recently used them for one of my all-hands meetings. Your toolbox adds professionalism to my slides. Instead of using standard clipart.
Claude Jones, Director of Engineer, @Walmartlabs, USA
I needed a fresh look at some of my slides. I've tried to find a way to create a paintbrush effect, to underline, accentuate, add some color and the handwritten markers were just the things. Very easy to use, easy to size, change the color. It was an affordable, perfect solution and I'm happy to recommend it.
Anonymous, US
The crisp, clean look of the graphics, and the fact that it allowed me to easily edit and change the colors to match the template was my main reason for purchasing them.
Brandie Jenkins, E-learning Developer, USA
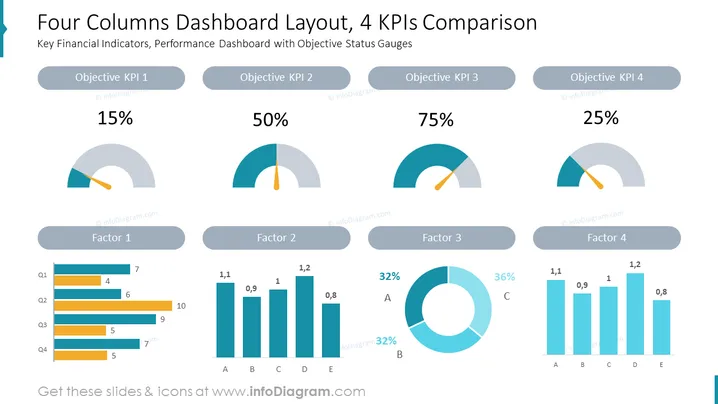
Die Folie mit dem Titel "Dashboard-Layout mit vier Spalten, Vergleich von 4 KPIs" zeigt wichtige finanzielle Indikatoren und ein Leistungsdashboard mit objektiven Statusanzeigen. Es gibt vier Anzeigen, die verschiedene Key Performance Indicators (KPIs) darstellen, wobei jede einen Prozentsatz für den Abschluss oder die Erreichung anzeigt. Unter jeder KPI-Anzeige befinden sich entsprechende Faktoren, die durch verschiedene Arten von Diagrammen dargestellt werden, die die oben dargestellten Daten unterstützen.
Das gesamte Erscheinungsbild der Folie ist sauber und professionell, mit einem Fokus auf Datenvisualisierung. Das Farbschema ist konsistent und verwendet Töne, die angenehm für die Augen sind, was die Lesbarkeit und den Fokus auf wichtige Informationen erhöht.



