Your graphics add a nice touch to my presentations and I recently used them for one of my all-hands meetings. Your toolbox adds professionalism to my slides. Instead of using standard clipart.
Claude Jones, Director of Engineer, @Walmartlabs, USA
Your graphics add a nice touch to my presentations and I recently used them for one of my all-hands meetings. Your toolbox adds professionalism to my slides. Instead of using standard clipart.
Claude Jones, Director of Engineer, @Walmartlabs, USA
I needed a fresh look at some of my slides. I've tried to find a way to create a paintbrush effect, to underline, accentuate, add some color and the handwritten markers were just the things. Very easy to use, easy to size, change the color. It was an affordable, perfect solution and I'm happy to recommend it.
Anonymous, US
The crisp, clean look of the graphics, and the fact that it allowed me to easily edit and change the colors to match the template was my main reason for purchasing them.
Brandie Jenkins, E-learning Developer, USA
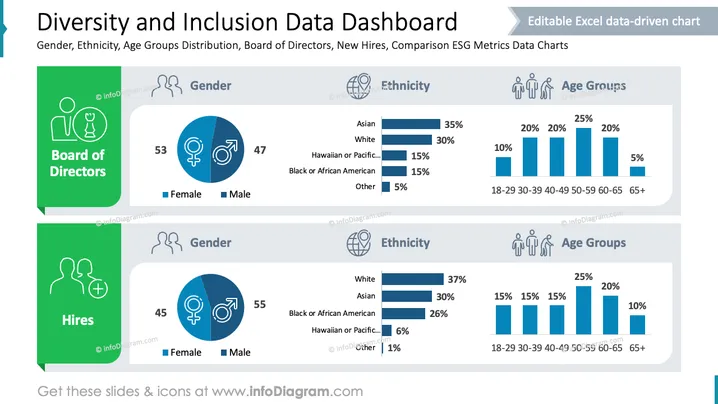
Die Folie präsentiert ein "Daten-Dashboard für Vielfalt und Inklusion", das sich auf die Verteilung von Geschlecht, Ethnizität und Altersgruppen konzentriert. Sie vergleicht die Daten zwischen dem "Vorstand" und "Einstellungen." Für den Vorstand zeigt die Geschlechterverteilung 53% weiblich und 47% männlich. Zu den Ethnien gehören 35% Asiaten, 30% Weiße, 15% Hawaiianer oder Pazifische Insulaner, 15% Schwarze oder Afroamerikaner und 5% Andere. Die Altersgruppen reichen von 18-29 mit 10% bis 65+ mit 5%. Bei den Einstellungen liegt der Frauenanteil bei 45% und der Männeranteil bei 55%; die Ethnien sind zu 37% Weiß, 30% Asiatisch, 26% Schwarz oder Afroamerikanisch, 6% Hawaiianisch oder Pazifisch Insulaner und 1% Andere. Die Altersgruppen variieren von 18-29 mit 15% bis 65+ mit 10%.
Die Folie nutzt effektiv visuelle Elemente, um die Statistiken zur Vielfalt hervorzuheben. Icons und Farbdifferenzierung bieten eine zugängliche, klare Präsentation der Daten.


