
Your graphics add a nice touch to my presentations and I recently used them for one of my all-hands meetings. Your toolbox adds professionalism to my slides. Instead of using standard clipart.
Claude Jones, Director of Engineer, @Walmartlabs, USA

Your graphics add a nice touch to my presentations and I recently used them for one of my all-hands meetings. Your toolbox adds professionalism to my slides. Instead of using standard clipart.
Claude Jones, Director of Engineer, @Walmartlabs, USA
I needed a fresh look at some of my slides. I've tried to find a way to create a paintbrush effect, to underline, accentuate, add some color and the handwritten markers were just the things. Very easy to use, easy to size, change the color. It was an affordable, perfect solution and I'm happy to recommend it.
Anonymous, US
The crisp, clean look of the graphics, and the fact that it allowed me to easily edit and change the colors to match the template was my main reason for purchasing them.
Brandie Jenkins, E-learning Developer, USA
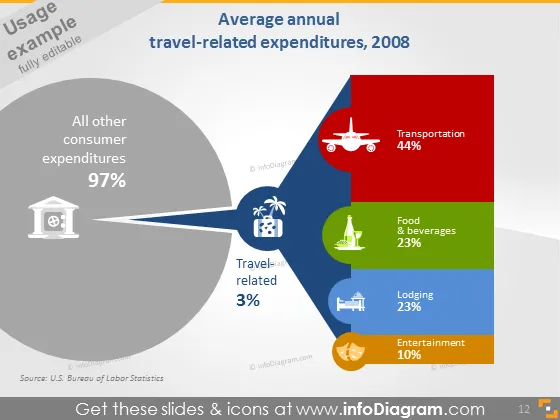
Die Folie zeigt eine Aufschlüsselung der reiserelevanten Ausgaben im Jahr 2008 und konzentriert sich auf den Anteil der Konsumausgaben, der in Reisen fließt. Ein großer Abschnitt im Tortendiagramm zeigt, dass 97% aller Verbraucherausgaben nicht reisebezogen sind, während ein kleiner Teil und die angrenzende Fläche 3% der reiserelevanten Ausgaben darstellen. Letztere wird weiter in Kategorien unterteilt wie Transport (44%), Essen & Getränke (23%), Unterkunft (23%) und Unterhaltung (10%), was jeweils impliziert, wie viel des Reisebudgets typischerweise auf diese Bereiche entfallen ist.
Die Folie hat ein professionelles und sauberes Design mit einem klaren Schwerpunkt auf visuelle Datenpräsentation. Die Verwendung von Icons und variierenden Farbintensitäten für unterschiedliche Kategorien hilft, die relativen Ausgaben in jedem Sektor schnell zu vermitteln.