

Your graphics add a nice touch to my presentations and I recently used them for one of my all-hands meetings. Your toolbox adds professionalism to my slides. Instead of using standard clipart.
Claude Jones, Director of Engineer, @Walmartlabs, USA

Your graphics add a nice touch to my presentations and I recently used them for one of my all-hands meetings. Your toolbox adds professionalism to my slides. Instead of using standard clipart.
Claude Jones, Director of Engineer, @Walmartlabs, USA
I needed a fresh look at some of my slides. I've tried to find a way to create a paintbrush effect, to underline, accentuate, add some color and the handwritten markers were just the things. Very easy to use, easy to size, change the color. It was an affordable, perfect solution and I'm happy to recommend it.
Anonymous, US
The crisp, clean look of the graphics, and the fact that it allowed me to easily edit and change the colors to match the template was my main reason for purchasing them.
Brandie Jenkins, E-learning Developer, USA
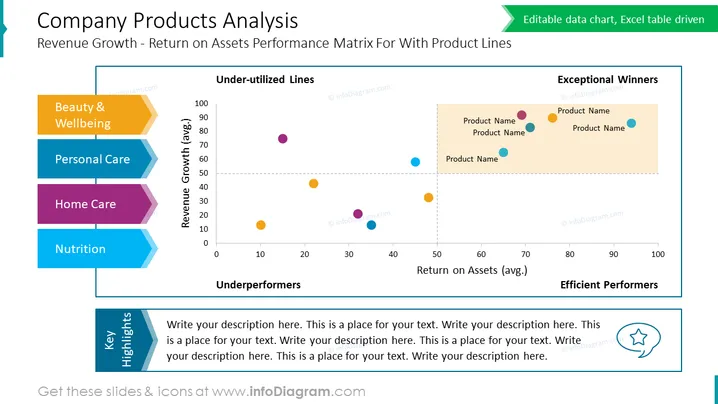
Die PowerPoint-Folie mit dem Titel „Analyse der Unternehmensprodukte“ visualisiert die Produktlinien eines Unternehmens anhand von zwei finanziellen Leistungskennzahlen: Umsatzwachstum und Gesamtkapitalrendite. Die Folie kategorisiert Produkte in vier Segmente, die durch farbige Blasen dargestellt werden: „Außergewöhnliche Gewinner“, „Effiziente Leistungsträger“, „Schwachstellen“ und „Nicht ausgelastete Linien“. Details zu Produktnamen sind neben den entsprechenden Blasen platziert. Eine Seitenleiste kategorisiert Produktlinien in „Beauty & Wellbeing“, „Personal Care“, „Home Care“ und „Nutrition“, die wahrscheinlich mit den farbcodierten Blasen im Diagramm übereinstimmen. Ein Abschnitt mit dem Titel „Key Highlights“ ist für die Textanalyse reserviert, vermutlich um Einblicke oder Kommentare zu den im Diagramm dargestellten Daten zu geben.
Das Foliendesign ist klar und professionell und verwendet eine begrenzte Farbpalette, um Datenpunkte und Kategorien klar zu unterscheiden. Es kombiniert effektiv grafische Elemente wie Streudiagramm, farbcodierte Legenden und Textabschnitte, um eine multidimensionale Analyse darzustellen.



