

Your graphics add a nice touch to my presentations and I recently used them for one of my all-hands meetings. Your toolbox adds professionalism to my slides. Instead of using standard clipart.
Claude Jones, Director of Engineer, @Walmartlabs, USA

Your graphics add a nice touch to my presentations and I recently used them for one of my all-hands meetings. Your toolbox adds professionalism to my slides. Instead of using standard clipart.
Claude Jones, Director of Engineer, @Walmartlabs, USA
I needed a fresh look at some of my slides. I've tried to find a way to create a paintbrush effect, to underline, accentuate, add some color and the handwritten markers were just the things. Very easy to use, easy to size, change the color. It was an affordable, perfect solution and I'm happy to recommend it.
Anonymous, US
The crisp, clean look of the graphics, and the fact that it allowed me to easily edit and change the colors to match the template was my main reason for purchasing them.
Brandie Jenkins, E-learning Developer, USA
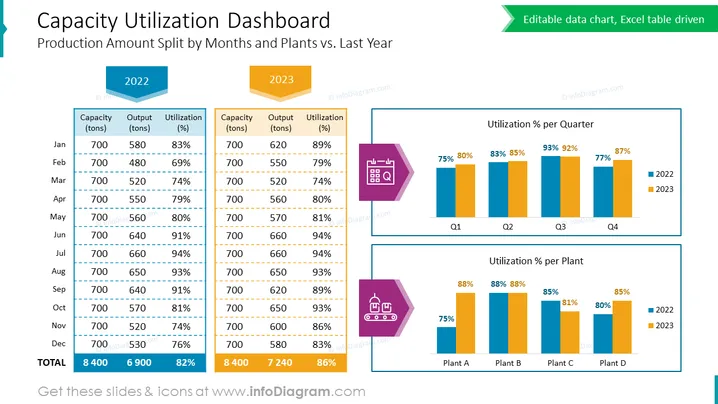
Die PowerPoint-Folie beschreibt ein „Kapazitätsauslastungs-Dashboard“, das die „Produktionsmenge aufgeteilt nach Monaten und Werken vs. letztes Jahr“ detailliert. Es zeigt einen Datenvergleich zwischen 2022 und 2023 für Kapazität, Leistung und Auslastung auf Monats- und Quartalsbasis sowie nach verschiedenen Werken. Die monatlichen Daten werden in zwei Tabellen präsentiert, eine für jedes Jahr, die eine konsistente Produktionskapazität von 700 Tonnen über alle Monate, unterschiedliche Leistungen in Tonnen und den daraus resultierenden Auslastungsprozentsatz zeigen. Eine jährliche Summe fasst die Daten zusammen. Zusätzlich veranschaulichen zwei Balkendiagramme den Auslastungsprozentsatz pro Quartal und pro Werk, wobei 2022 mit 2023 verglichen wird.
Das gesamte Erscheinungsbild der Folie ist professionell, mit einem klaren Layout, das Farben verwendet, um zwischen Jahren und Datentypen zu unterscheiden. Das Design ist sauber und nutzt visuelle Elemente wie 3D-Tags und farbcodierte Diagramme zur einfachen Interpretation und zum Vergleich von Daten.



