

Your graphics add a nice touch to my presentations and I recently used them for one of my all-hands meetings. Your toolbox adds professionalism to my slides. Instead of using standard clipart.
Claude Jones, Director of Engineer, @Walmartlabs, USA

Your graphics add a nice touch to my presentations and I recently used them for one of my all-hands meetings. Your toolbox adds professionalism to my slides. Instead of using standard clipart.
Claude Jones, Director of Engineer, @Walmartlabs, USA
I needed a fresh look at some of my slides. I've tried to find a way to create a paintbrush effect, to underline, accentuate, add some color and the handwritten markers were just the things. Very easy to use, easy to size, change the color. It was an affordable, perfect solution and I'm happy to recommend it.
Anonymous, US
The crisp, clean look of the graphics, and the fact that it allowed me to easily edit and change the colors to match the template was my main reason for purchasing them.
Brandie Jenkins, E-learning Developer, USA
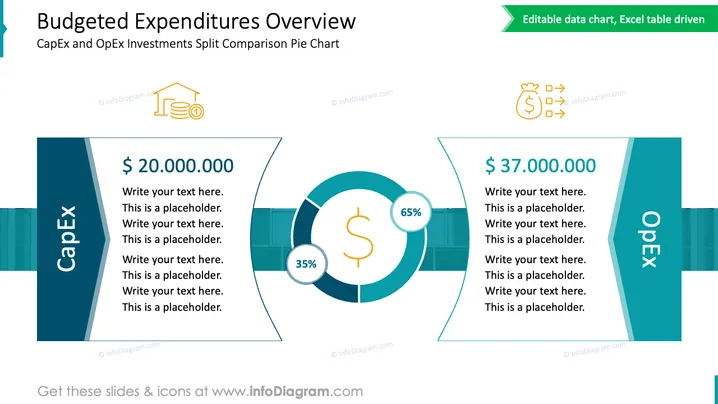
Die Folie bietet einen visuellen Vergleich von Investitionsausgaben (CapEx) versus Betriebsausgaben (OpEx) mithilfe eines Kreisdiagramms und begleitender Textfelder. CapEx (35 %) scheint deutlich niedriger zu sein als OpEx (65 %), mit Geldbeträgen für jede Kategorie (20.000.000 $ für CapEx und 37.000.000 $ für OpEx). Diese Zahlen geben die Zuweisung der budgetierten Investitionen an, wobei sich CapEx typischerweise auf die von einem Unternehmen verwendeten Mittel zum Erwerb, zur Modernisierung und zur Instandhaltung von Sachanlagen wie Immobilien, Industriegebäuden oder Ausrüstung bezieht, und OpEx auf die laufenden Kosten für den Betrieb eines Produkts, Geschäfts oder Systems.
Das Gesamtbild der Folie ist professionell und visuell ansprechend, mit einem Farbschema, das die Unterscheidung zwischen den beiden Ausgabenarten erleichtert.



