

Your graphics add a nice touch to my presentations and I recently used them for one of my all-hands meetings. Your toolbox adds professionalism to my slides. Instead of using standard clipart.
Claude Jones, Director of Engineer, @Walmartlabs, USA

Your graphics add a nice touch to my presentations and I recently used them for one of my all-hands meetings. Your toolbox adds professionalism to my slides. Instead of using standard clipart.
Claude Jones, Director of Engineer, @Walmartlabs, USA
I needed a fresh look at some of my slides. I've tried to find a way to create a paintbrush effect, to underline, accentuate, add some color and the handwritten markers were just the things. Very easy to use, easy to size, change the color. It was an affordable, perfect solution and I'm happy to recommend it.
Anonymous, US
The crisp, clean look of the graphics, and the fact that it allowed me to easily edit and change the colors to match the template was my main reason for purchasing them.
Brandie Jenkins, E-learning Developer, USA
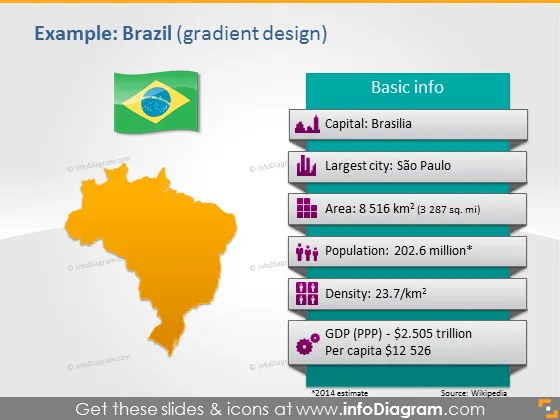
Die Folie bietet grundlegende Informationen über Brasilien auf klare und visuell unterschiedliche Weise. Die Folie mit dem Titel "Beispiel: Brasilien (Gradient-Design)" enthält eine Liste von Grundwissen wie die Hauptstadt Brasília; São Paulo als größte Stadt; eine Fläche von 8.516 km², was 3.287 Quadratmeilen entspricht; eine beträchtliche Bevölkerung von etwa 202,6 Millionen; eine Bevölkerungsdichte von 23,7 Personen pro km²; und einen wirtschaftlichen Überblick mit einem BIP (Kaufkraftparität) von etwa 2,505 Billionen USD und einem Pro-Kopf-Einkommen von 12.526 USD.
Die Folie verwendet kontrastierende Farben, mit einem hellen Hintergrund und lebendigen Farbverläufen, um die Informationen hervorzuheben. Die Verwendung von Symbolen, die mit jedem Datenpunkt verbunden sind, ermöglicht eine einfache visuelle Referenz und verbessert die allgemeine ästhetische Anziehungskraft.



