

Your graphics add a nice touch to my presentations and I recently used them for one of my all-hands meetings. Your toolbox adds professionalism to my slides. Instead of using standard clipart.
Claude Jones, Director of Engineer, @Walmartlabs, USA

Your graphics add a nice touch to my presentations and I recently used them for one of my all-hands meetings. Your toolbox adds professionalism to my slides. Instead of using standard clipart.
Claude Jones, Director of Engineer, @Walmartlabs, USA
I needed a fresh look at some of my slides. I've tried to find a way to create a paintbrush effect, to underline, accentuate, add some color and the handwritten markers were just the things. Very easy to use, easy to size, change the color. It was an affordable, perfect solution and I'm happy to recommend it.
Anonymous, US
The crisp, clean look of the graphics, and the fact that it allowed me to easily edit and change the colors to match the template was my main reason for purchasing them.
Brandie Jenkins, E-learning Developer, USA
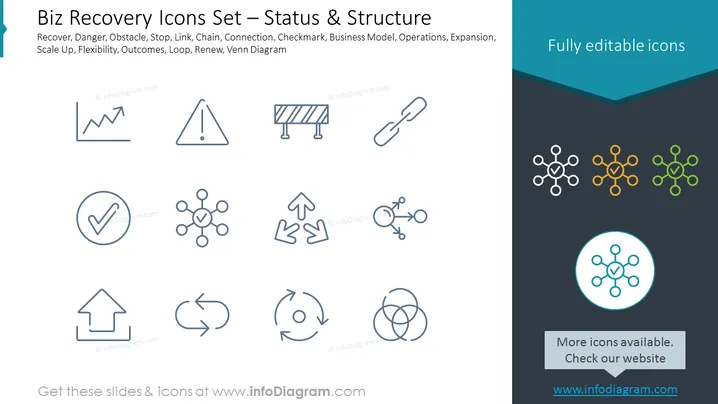
Diese PowerPoint-Folie mit dem Titel 'Biz Recovery Icons Set – Status & Struktur' präsentiert eine Sammlung von Symbolen, die sich auf die Unternehmenswiederherstellung und die organisatorische Struktur beziehen. Sie enthält Symbole für 'Erholen', was eine Rückkehr zur Normalität suggeriert, 'Gefahr', das potenzielle Risiken anzeigt, 'Hindernis', das Herausforderungen darstellt, 'Stopp', was eine Pause oder das Ende eines Prozesses bedeuten könnte, und 'Verbindung', das Beziehungen oder Verknüpfungen bezeichnet. Das Symbol 'Kette' kann Interkonnektivität oder Abhängigkeiten implizieren, 'Verbindung' betont weiter die zusammenhängenden Elemente, und das 'Häkchen' steht typischerweise für Genehmigung oder Vollständigkeit. 'Geschäftsmodell', 'Betrieb', 'Expansion', 'Hochskalierung', 'Flexibilität' und 'Ergebnisse' sind Konzepte, die für strategische Planung und Wachstum entscheidend sind. 'Schleife' bedeutet einen Feedback-Mechanismus oder einen kontinuierlichen Prozess, 'Erneuern' impliziert Belebung oder Updates, und 'Venn-Diagramm' stellt überlappende Beziehungen oder Kriterien dar.



