

Your graphics add a nice touch to my presentations and I recently used them for one of my all-hands meetings. Your toolbox adds professionalism to my slides. Instead of using standard clipart.
Claude Jones, Director of Engineer, @Walmartlabs, USA

Your graphics add a nice touch to my presentations and I recently used them for one of my all-hands meetings. Your toolbox adds professionalism to my slides. Instead of using standard clipart.
Claude Jones, Director of Engineer, @Walmartlabs, USA
I needed a fresh look at some of my slides. I've tried to find a way to create a paintbrush effect, to underline, accentuate, add some color and the handwritten markers were just the things. Very easy to use, easy to size, change the color. It was an affordable, perfect solution and I'm happy to recommend it.
Anonymous, US
The crisp, clean look of the graphics, and the fact that it allowed me to easily edit and change the colors to match the template was my main reason for purchasing them.
Brandie Jenkins, E-learning Developer, USA
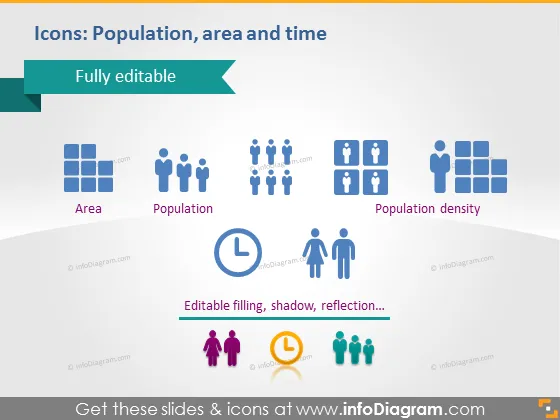
Die Folie hat zum Ziel, eine Sammlung vollständig bearbeitbarer Icons zu präsentieren, die mit Demografie und zeitlichen Konzepten verbunden sind. "Fläche" wird durch quadratische Blöcke symbolisiert, die einen gerasterten Raum darstellen, der typischerweise mit geografischem Territorium assoziiert wird. "Bevölkerung" wird durch eine Gruppe von Menschenfiguren bezeichnet, die die Anzahl der Personen in einem gegebenen Gebiet signifiziert. "Bevölkerungsdichte" kombiniert die Icons von Fläche und Bevölkerung, um die Anzahl der Menschen pro Flächeneinheit anzuzeigen, ein entscheidendes demografisches Maß. Schließlich deutet ein Uhren-Symbol neben einem Mann und einer Frau auf Aspekte der Zeit in Bezug auf die Demografie hin, wie Wachstumsraten oder zeitliche Veränderungen.
Die Folie hat ein professionelles und sauberes Layout, mit einer Farbpalette, die ein Gefühl von Methodik und Struktur vermittelt. Die Icons und der Text sind gut organisiert und bieten eine klare visuelle Botschaft.



