Spanien demografische Länderinformationen Dashboard
Folieninhalt
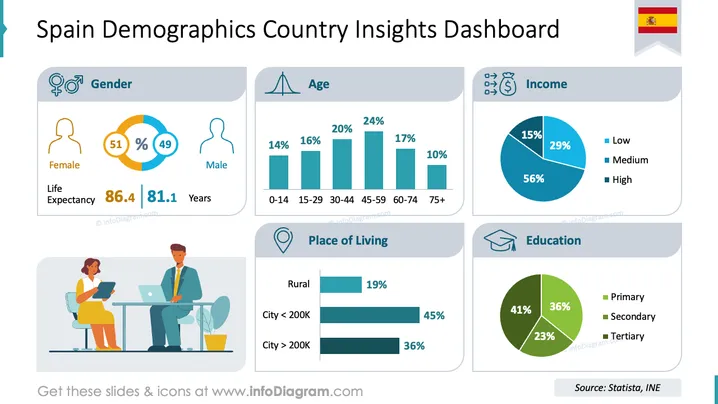
Diese Folie präsentiert einen Überblick über die Demografie in Spanien und hebt wichtige Statistiken nach Geschlecht, Alter, Einkommen, Wohnort und Bildung hervor.
Geschlecht: Die Bevölkerung ist nahezu ausgewogen, mit Frauen bei 51 % und Männern bei 49 %, bei einer Lebenserwartung von 86,4 Jahren für Frauen und 81,1 Jahren für Männer.
Alter: Die Altersverteilung zeigt eine unterschiedliche Vertretung, wobei 0-14 Jahre 14 %, 15-29 Jahre 16 %, 30-44 Jahre 20 %, 45-59 Jahre 24 %, 60-74 Jahre 17 % und 75+ Jahre 10 % ausmachen.
Einkommen: Die Einkommensniveaus zeigen 15 % niedrig, 29 % mittel und 56 % hoch.
Wohnort: Die Wohnverteilung gibt an, dass 19 % in ländlichen Gebieten leben, 45 % in Städten mit weniger als 200.000 Einwohnern und 36 % in größeren Städten.
Bildung: Der Bildungsabschluss umfasst 36 % in der Primarstufe, 41 % in der Sekundarstufe und 23 % in der Tertiärbildung.
Grafische Darstellung
- Die Folie hat ein sauberes, strukturiertes Layout mit sechs klar definierten Abschnitten.
- Geschlechtsabschnitt: Enthält eine kreisförmige Prozentgrafik mit männlichen und weiblichen Symbolen, wobei Orange und Blau zur Unterscheidung verwendet werden.
- Altersabschnitt: Zeigt ein Histogramm mit türkisfarbenen Balken für verschiedene Altersgruppen.
- Einkommensabschnitt: Stellt Daten in einem Tortendiagramm dar und verwendet Blautöne zur Kennzeichnung der Einkommensniveaus.
- Wohnortsabschnitt: Zeigt ein Balkendiagramm, das den Wohnort darstellt, hervorgehoben mit verschiedenen Türkistönen.
- Bildungsabschnitt: Veranschaulicht Bildungsdaten durch ein grün schattiertes Tortendiagramm.
- Die spanische Flagge ist in der oberen rechten Ecke abgebildet und fügt einen kulturellen Kontext hinzu.
Die gesamte Folie präsentiert eine professionelle und visuell ansprechende Komposition, die einheitliche Farbpaletten und Symbole verwendet, um ein einfaches Verständnis zu ermöglichen. Die Kombination aus Tortendiagrammen, Balkendiagrammen und Symbolen verbessert die Datenvisualisierung.
Anwendungsfälle
- Präsentation von demografischen Einblicken für Stakeholder zur Marktanalyse.
- Bildungseminare mit Schwerpunkt auf Bevölkerungsstudien und -trends.
- Geschäftstrategiesitzungen zum Verständnis der Verbraucherdemografie.
- Planungssitzungen von Regierungspolitik bezüglich gesellschaftlicher Bedürfnisse.