Your graphics add a nice touch to my presentations and I recently used them for one of my all-hands meetings. Your toolbox adds professionalism to my slides. Instead of using standard clipart.
Claude Jones, Director of Engineer, @Walmartlabs, USA
Your graphics add a nice touch to my presentations and I recently used them for one of my all-hands meetings. Your toolbox adds professionalism to my slides. Instead of using standard clipart.
Claude Jones, Director of Engineer, @Walmartlabs, USA
I needed a fresh look at some of my slides. I've tried to find a way to create a paintbrush effect, to underline, accentuate, add some color and the handwritten markers were just the things. Very easy to use, easy to size, change the color. It was an affordable, perfect solution and I'm happy to recommend it.
Anonymous, US
The crisp, clean look of the graphics, and the fact that it allowed me to easily edit and change the colors to match the template was my main reason for purchasing them.
Brandie Jenkins, E-learning Developer, USA
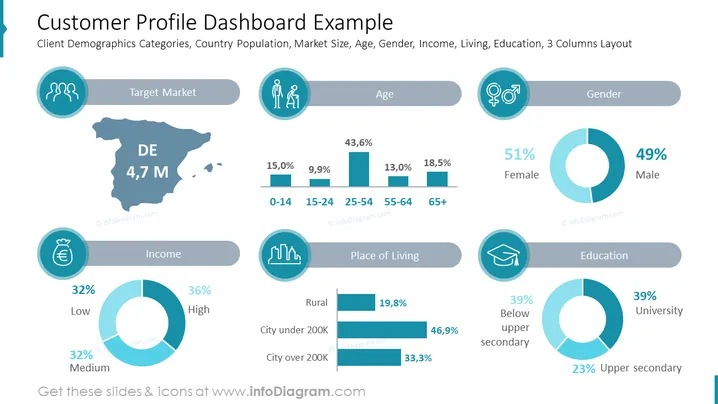
Diese PowerPoint-Folie trägt den Titel "Beispiele für das Kundenprofil-Dashboard" und bietet eine visuelle Darstellung der demografischen Daten eines Kunden mit Segmenten wie Zielmarkt, Alter, Geschlecht, Einkommen, Wohnort und Bildung. Jede Kategorie nutzt Icons und grafische Datenvisualisierungen wie Tortendiagramme und Balkendiagramme, um wichtige Statistiken zu liefern. Zum Beispiel gliedert die Kategorie Alter die Bevölkerung nach Altersgruppen und zeigt Prozentsätze für jede Gruppe, während die Kategorie Geschlecht eine nahezu gleichmäßige Verteilung zwischen Frauen (51%) und Männern (49%) anzeigt.
Das Gesamtbild der Folie ist schlank und modern, mit einem zusammenhängenden Farbschema und visuellen Hilfsmitteln, die das schnelle Verständnis der demografischen Daten erleichtern.


