

Your graphics add a nice touch to my presentations and I recently used them for one of my all-hands meetings. Your toolbox adds professionalism to my slides. Instead of using standard clipart.
Claude Jones, Director of Engineer, @Walmartlabs, USA

Your graphics add a nice touch to my presentations and I recently used them for one of my all-hands meetings. Your toolbox adds professionalism to my slides. Instead of using standard clipart.
Claude Jones, Director of Engineer, @Walmartlabs, USA
I needed a fresh look at some of my slides. I've tried to find a way to create a paintbrush effect, to underline, accentuate, add some color and the handwritten markers were just the things. Very easy to use, easy to size, change the color. It was an affordable, perfect solution and I'm happy to recommend it.
Anonymous, US
The crisp, clean look of the graphics, and the fact that it allowed me to easily edit and change the colors to match the template was my main reason for purchasing them.
Brandie Jenkins, E-learning Developer, USA
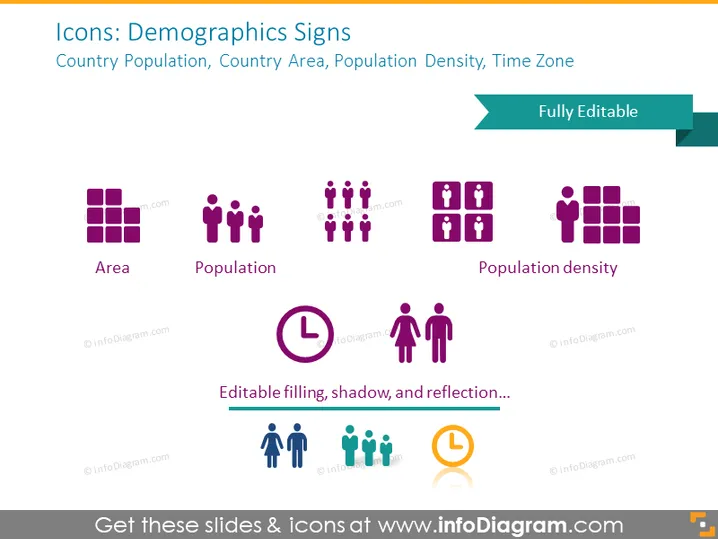
Die PowerPoint-Folie trägt den Titel "Symbole: Demografische Zeichen" und befasst sich mit visuellen Darstellungen demografischer Daten. Die Folie enthält Symbole, die die "Bevölkerung des Landes", "Fläche des Landes", "Bevölkerungsdichte" und "Zeitzone" repräsentieren. Diese Symbole bieten eine visuelle Kurzfassung, um komplexe demografische Informationen prägnant zu vermitteln. " Fläche" wird mit einem Gitter aus Quadraten dargestellt, das das Maß der physischen Landausdehnung anzeigt. "Bevölkerung" wird mit einer Gruppe von Figuren dargestellt, die die Anzahl der Menschen in einem bestimmten Gebiet vorschlägt. "Bevölkerungsdichte" kombiniert die Figuren- und Gitterelemente, um die Anzahl der Menschen pro Flächeneinheit darzustellen.
Die Folie hat ein modernes und sauberes Design, mit viel Weißraum um die Symbole und den Text für einen übersichtlichen Look. Die Verwendung eines einheitlichen Farbschemas für die Symbole sorgt für eine visuelle Konsistenz auf der gesamten Folie.



