
Your graphics add a nice touch to my presentations and I recently used them for one of my all-hands meetings. Your toolbox adds professionalism to my slides. Instead of using standard clipart.
Claude Jones, Director of Engineer, @Walmartlabs, USA
Your graphics add a nice touch to my presentations and I recently used them for one of my all-hands meetings. Your toolbox adds professionalism to my slides. Instead of using standard clipart.
Claude Jones, Director of Engineer, @Walmartlabs, USA
I needed a fresh look at some of my slides. I've tried to find a way to create a paintbrush effect, to underline, accentuate, add some color and the handwritten markers were just the things. Very easy to use, easy to size, change the color. It was an affordable, perfect solution and I'm happy to recommend it.
Anonymous, US
The crisp, clean look of the graphics, and the fact that it allowed me to easily edit and change the colors to match the template was my main reason for purchasing them.
Brandie Jenkins, E-learning Developer, USA
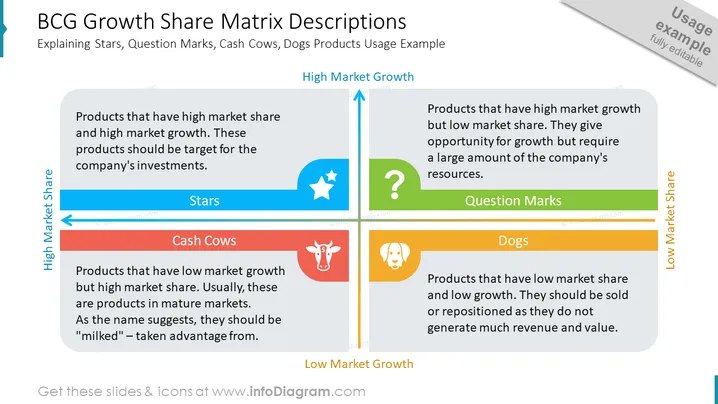
Die Folie konzentriert sich darauf, die vier Kategorien der Boston Consulting Group (BCG) Wachstum-Anteil Matrix zu erklären: Stars, Fragezeichen, Cash Cows und Hunde. Stars repräsentieren Produkte mit hohem Marktanteil und Wachstum, ideal für Investitionen. Fragezeichen haben ein hohes Wachstum, aber einen niedrigen Marktanteil, was erhebliche Ressourcen erfordert. Cash Cows haben einen hohen Marktanteil, aber ein niedriges Wachstum, was darauf hinweist, dass sie zur Gewinnerzielung genutzt werden sollten. Hunde haben einen niedrigen Marktanteil und Wachstum, was darauf hindeutet, dass sie verkauft oder umplatziert werden sollten, da ihr Umsatzpotenzial begrenzt ist.
Das Gesamtbild der Folie ist klar und farbenfroh, mit einem professionellen Layout, das darauf ausgelegt ist, ein einfaches Verständnis der BCG-Matrix-Konzepte zu erleichtern. Der Einsatz von Symbolen und kräftigen Farben in den Quadranten unterstützt die visuelle Unterscheidung jeder Kategorie.




