

Your graphics add a nice touch to my presentations and I recently used them for one of my all-hands meetings. Your toolbox adds professionalism to my slides. Instead of using standard clipart.
Claude Jones, Director of Engineer, @Walmartlabs, USA

Your graphics add a nice touch to my presentations and I recently used them for one of my all-hands meetings. Your toolbox adds professionalism to my slides. Instead of using standard clipart.
Claude Jones, Director of Engineer, @Walmartlabs, USA
I needed a fresh look at some of my slides. I've tried to find a way to create a paintbrush effect, to underline, accentuate, add some color and the handwritten markers were just the things. Very easy to use, easy to size, change the color. It was an affordable, perfect solution and I'm happy to recommend it.
Anonymous, US
The crisp, clean look of the graphics, and the fact that it allowed me to easily edit and change the colors to match the template was my main reason for purchasing them.
Brandie Jenkins, E-learning Developer, USA
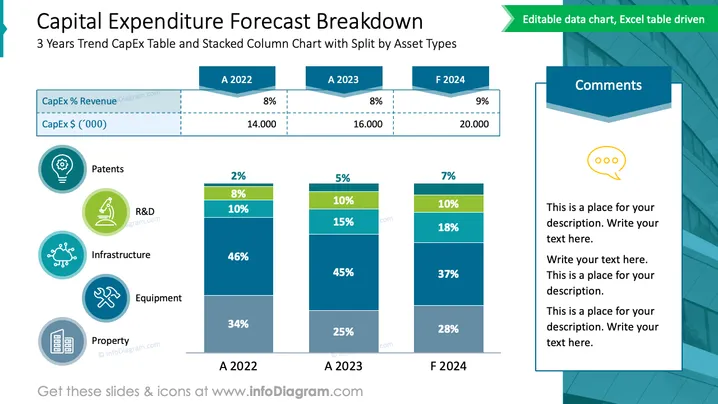
Die Folie zeigt einen 3-Jahres-Trend der Investitionsausgaben (CapEx) mit einem gestapelten Säulendiagramm, das die Ausgaben nach Anlagearten wie Patente, F&E, Infrastruktur, Ausrüstung und Eigentum aufschlüsselt. Die Umsatzprozentsätze und Gesamtkapitalwertwerte in Tausendern sind für jedes Jahr angegeben und zeigen einen leichten Anstieg der für F 2024 prognostizierten Ausgaben. Auf der linken Seite sind die verschiedenen Anlagearten mit zugehörigen Symbolen aufgeführt. Ein Abschnitt "Kommentare" auf der rechten Seite weist darauf hin, wo zusätzliche Kontextinformationen oder Erklärungen eingefügt werden könnten.
Die Folie hat eine ausgewogene Komposition mit gleichmäßig verteilten grafischen Elementen und Textfeldern. Die kühle Farbpalette verleiht ihr ein geschäftliches und analytisches Gefühl, und die Mischung aus Symbolen und Diagrammen erleichtert eine ansprechende Datenpräsentation.



