Your graphics add a nice touch to my presentations and I recently used them for one of my all-hands meetings. Your toolbox adds professionalism to my slides. Instead of using standard clipart.
Claude Jones, Director of Engineer, @Walmartlabs, USA
Your graphics add a nice touch to my presentations and I recently used them for one of my all-hands meetings. Your toolbox adds professionalism to my slides. Instead of using standard clipart.
Claude Jones, Director of Engineer, @Walmartlabs, USA
I needed a fresh look at some of my slides. I've tried to find a way to create a paintbrush effect, to underline, accentuate, add some color and the handwritten markers were just the things. Very easy to use, easy to size, change the color. It was an affordable, perfect solution and I'm happy to recommend it.
Anonymous, US
The crisp, clean look of the graphics, and the fact that it allowed me to easily edit and change the colors to match the template was my main reason for purchasing them.
Brandie Jenkins, E-learning Developer, USA
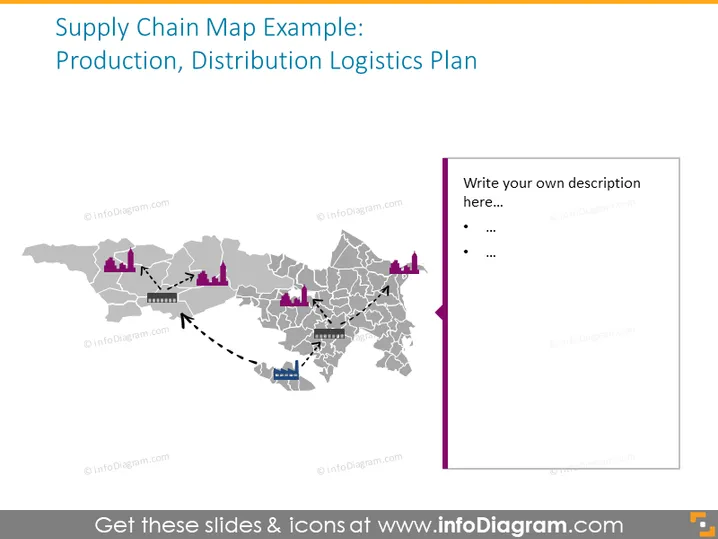
Die Folie zeigt eine visuelle Darstellung einer Lieferkette auf einer geografischen Karte und zeigt den Fluss von Waren von der Produktion bis zur Distribution. Sie umfasst Fabriken, Lagerhäuser und verschiedene Transportmittel und verdeutlicht die Komplexität und die miteinander verbundene Natur der Logistik im Geschäft. Jeder Standort symbolisiert einen kritischen Knoten in der Lieferkette, wie Produktionsanlagen, Verteilungszentren oder Versandhubs, und die Pfeile zeigen die Richtung der Warenbewegung an, was Einblicke in die Struktur und die logistischen Wege der Lieferkette bietet.
Die Folie präsentiert ein sauberes und einfaches Design mit einem Farbschema, das die wichtigen Aspekte der Lieferkette hervorhebt. Die Wahl der Icons und der gerichteten Linien vermittelt klar den Fluss der Waren innerhalb des logistischen Netzwerks.


