
Your graphics add a nice touch to my presentations and I recently used them for one of my all-hands meetings. Your toolbox adds professionalism to my slides. Instead of using standard clipart.
Claude Jones, Director of Engineer, @Walmartlabs, USA

Your graphics add a nice touch to my presentations and I recently used them for one of my all-hands meetings. Your toolbox adds professionalism to my slides. Instead of using standard clipart.
Claude Jones, Director of Engineer, @Walmartlabs, USA

I needed a fresh look at some of my slides. I've tried to find a way to create a paintbrush effect, to underline, accentuate, add some color and the handwritten markers were just the things. Very easy to use, easy to size, change the color. It was an affordable, perfect solution and I'm happy to recommend it.
Anonymous, US
The crisp, clean look of the graphics, and the fact that it allowed me to easily edit and change the colors to match the template was my main reason for purchasing them.
Brandie Jenkins, E-learning Developer, USA
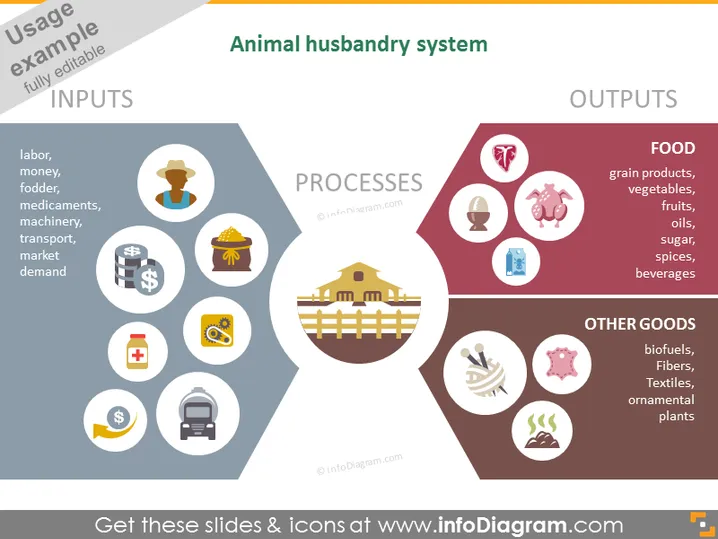
Die Folie mit dem Titel "Tierhaltungsystem" zeigt eine schematische Darstellung des Systems, das in drei Hauptkomponenten unterteilt ist: Inputs, Prozesse und Outputs. Die Inputs umfassen Arbeitskräfte, Geld, Futter, Medikamente, Maschinen, Transport und Marktnachfrage. Jeder dieser Inputs ist entscheidend für den Betrieb eines Tierhaltungsystems; zum Beispiel steht Arbeitskraft für die menschliche Arbeitskraft, die beteiligt ist, während Futter das Futter ist, das den Tieren bereitgestellt wird. Die Prozesse werden durch ein Gebäude symbolisiert, das den Ort darstellt, an dem die Tierhaltung stattfindet. Outputs werden in "Nahrungsmittel" eingeteilt, mit Artikeln wie Getreideprodukten, Gemüse und Getränken, und erklären die Vielfalt der Konsumgüter, die aus der Tierhaltung stammen; sowie "Sonstige Waren", wie Biokraftstoffe und Textilien, die ebenfalls im System produziert werden.


