

Your graphics add a nice touch to my presentations and I recently used them for one of my all-hands meetings. Your toolbox adds professionalism to my slides. Instead of using standard clipart.
Claude Jones, Director of Engineer, @Walmartlabs, USA

Your graphics add a nice touch to my presentations and I recently used them for one of my all-hands meetings. Your toolbox adds professionalism to my slides. Instead of using standard clipart.
Claude Jones, Director of Engineer, @Walmartlabs, USA
I needed a fresh look at some of my slides. I've tried to find a way to create a paintbrush effect, to underline, accentuate, add some color and the handwritten markers were just the things. Very easy to use, easy to size, change the color. It was an affordable, perfect solution and I'm happy to recommend it.
Anonymous, US
The crisp, clean look of the graphics, and the fact that it allowed me to easily edit and change the colors to match the template was my main reason for purchasing them.
Brandie Jenkins, E-learning Developer, USA
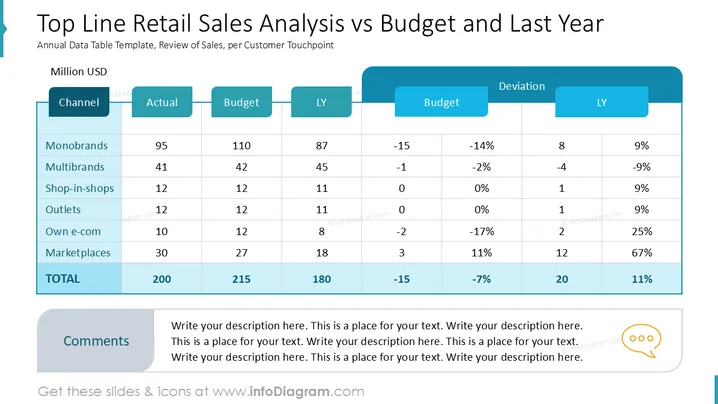
Diese Folie präsentiert einen Bericht zur Analyse der Einzelhandelsumsätze, der die tatsächlichen Umsätze, Budgets und die Zahlen des Vorjahres über verschiedene Kanäle hinweg vergleicht.
Die Folie enthält eine übersichtlich organisierte Tabelle mit abwechselnd schattierten Zeilen zur besseren Lesbarkeit.
Die Überschriften für "Kanal," "Tatsächlich," "Budget," "LY," und "Abweichung" sind in fetter Schrift auf farbigen Hintergründen.
Die Tabelle verwendet Türkis und Hellblau zur Hervorhebung von Summen und zur Betonung.
Abgerundete Kästchen und durchgehende Schriftart für ein modernes, sauberes Erscheinungsbild.
Kommentarsektion unten, in einem abgerundeten Kästchen mit einem Sprechblasen-Icon eingeschlossen.
Die Folie zeigt eine ausgewogene Kombination aus Text und Farbe und bietet einen professionellen und strukturierten finanziellen Überblick.



