Your graphics add a nice touch to my presentations and I recently used them for one of my all-hands meetings. Your toolbox adds professionalism to my slides. Instead of using standard clipart.
Claude Jones, Director of Engineer, @Walmartlabs, USA
Your graphics add a nice touch to my presentations and I recently used them for one of my all-hands meetings. Your toolbox adds professionalism to my slides. Instead of using standard clipart.
Claude Jones, Director of Engineer, @Walmartlabs, USA
I needed a fresh look at some of my slides. I've tried to find a way to create a paintbrush effect, to underline, accentuate, add some color and the handwritten markers were just the things. Very easy to use, easy to size, change the color. It was an affordable, perfect solution and I'm happy to recommend it.
Anonymous, US
The crisp, clean look of the graphics, and the fact that it allowed me to easily edit and change the colors to match the template was my main reason for purchasing them.
Brandie Jenkins, E-learning Developer, USA
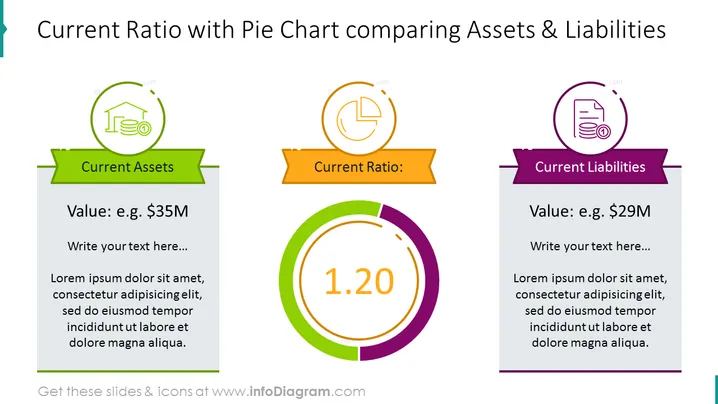
Folie Vorlage zum Vergleich von zwei Faktoren: aktuellen Vermögenswerten und aktuellen Verbindlichkeiten. Beschreiben Sie Ihre Herausforderungen, heben Sie wichtige Finanzwerte hervor und drücken Sie das aktuelle Verhältnis ihrer Beziehung mit einem bearbeitbaren Excel-gesteuerten Tortendiagramm aus. Verwenden Sie aussagekräftige Icons für die Lesbarkeit und ein professionelles Erscheinungsbild.
Diese Vorlage für das aktuelle Verhältnis Tortendiagramm zum Vergleich von Vermögenswerten und Verbindlichkeiten ist Teil unserer Unternehmensfinanzdaten-Diagramm PPT-Vorlage.


