
Your graphics add a nice touch to my presentations and I recently used them for one of my all-hands meetings. Your toolbox adds professionalism to my slides. Instead of using standard clipart.
Claude Jones, Director of Engineer, @Walmartlabs, USA

Your graphics add a nice touch to my presentations and I recently used them for one of my all-hands meetings. Your toolbox adds professionalism to my slides. Instead of using standard clipart.
Claude Jones, Director of Engineer, @Walmartlabs, USA

I needed a fresh look at some of my slides. I've tried to find a way to create a paintbrush effect, to underline, accentuate, add some color and the handwritten markers were just the things. Very easy to use, easy to size, change the color. It was an affordable, perfect solution and I'm happy to recommend it.
Anonymous, US
The crisp, clean look of the graphics, and the fact that it allowed me to easily edit and change the colors to match the template was my main reason for purchasing them.
Brandie Jenkins, E-learning Developer, USA
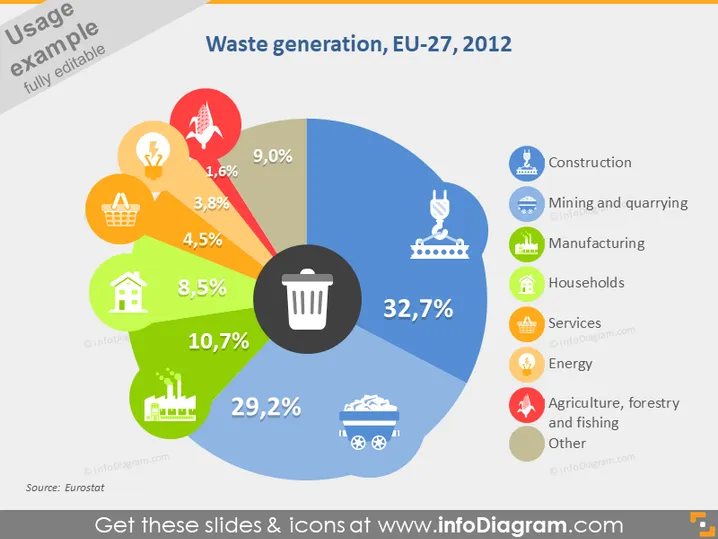
Diese Folie präsentiert Daten zum Abfallaufkommen innerhalb der EU-27 im Jahr 2012. Sie verwendet ein Tortendiagramm, um den Anteil des von verschiedenen Sektoren erzeugten Abfalls zu veranschaulichen. Haushalte sind mit 32,7% für den größten Anteil verantwortlich, gefolgt von der Industrie (29,2%) und den Dienstleistungen (10,7%). Andere enthaltene Sektoren, wie der Bau (9,0%), Energie (4,5%) und Landwirtschaft, Forstwirtschaft und Fischerei (1,6%), tragen jeweils kleinere Prozentsätze bei, was ihren relativen Einfluss auf das Abfallaufkommen zeigt.
Die Folie hat ein sauberes, modernes Aussehen mit einem lebendigen Farbschema. Die Verwendung von Icons neben den Segmenten des Tortendiagramms ermöglicht eine intuitive und visuell ansprechende Darstellung der Daten.


