
Your graphics add a nice touch to my presentations and I recently used them for one of my all-hands meetings. Your toolbox adds professionalism to my slides. Instead of using standard clipart.
Claude Jones, Director of Engineer, @Walmartlabs, USA

Your graphics add a nice touch to my presentations and I recently used them for one of my all-hands meetings. Your toolbox adds professionalism to my slides. Instead of using standard clipart.
Claude Jones, Director of Engineer, @Walmartlabs, USA
I needed a fresh look at some of my slides. I've tried to find a way to create a paintbrush effect, to underline, accentuate, add some color and the handwritten markers were just the things. Very easy to use, easy to size, change the color. It was an affordable, perfect solution and I'm happy to recommend it.
Anonymous, US
The crisp, clean look of the graphics, and the fact that it allowed me to easily edit and change the colors to match the template was my main reason for purchasing them.
Brandie Jenkins, E-learning Developer, USA
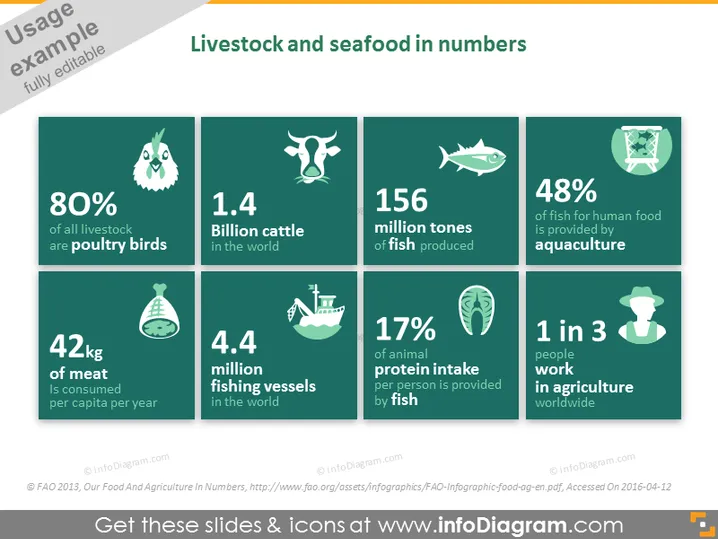
Die Folie präsentiert Statistiken über Viehzucht und Meeresfrüchte und hebt die Häufigkeit von Geflügel in der Viehzucht hervor, die Anzahl der Rinder weltweit, die Fischproduktion, den Beitrag der Aquakultur zur Fischversorgung für die menschliche Ernährung, den Fleischverbrauch pro Person, die Anzahl der Fischereifahrzeuge, den Anteil der tierischen Eiweißaufnahme durch Fisch und die Anzahl der Menschen, die weltweit in der Landwirtschaft arbeiten. Jede Statistik wird durch eine Zahl oder einen Prozentsatz dargestellt, der einen schnellen numerischen Überblick über die jeweilige Kategorie bietet – wie beispielsweise 80% aller Nutztiere, die Geflügel sind, was ihre Dominanz im Viehzuchtsektor impliziert, oder 1 von 3 Menschen, die in der Landwirtschaft arbeiten, was auf den erheblichen Beschäftigungsumfang des Sektors hinweist.
Das gesamte Aussehen der Folie ist modern und professionell, mit einem starken Farbkontrast, der das Verständnis und die Beibehaltung der präsentierten Daten unterstützt. Der Einsatz von Icons fügt ein visuelles Signal hinzu, das hilft, die Zahlen schnell mit der entsprechenden Statistik zu assoziieren.