
Your graphics add a nice touch to my presentations and I recently used them for one of my all-hands meetings. Your toolbox adds professionalism to my slides. Instead of using standard clipart.
Claude Jones, Director of Engineer, @Walmartlabs, USA
Your graphics add a nice touch to my presentations and I recently used them for one of my all-hands meetings. Your toolbox adds professionalism to my slides. Instead of using standard clipart.
Claude Jones, Director of Engineer, @Walmartlabs, USA
I needed a fresh look at some of my slides. I've tried to find a way to create a paintbrush effect, to underline, accentuate, add some color and the handwritten markers were just the things. Very easy to use, easy to size, change the color. It was an affordable, perfect solution and I'm happy to recommend it.
Anonymous, US
The crisp, clean look of the graphics, and the fact that it allowed me to easily edit and change the colors to match the template was my main reason for purchasing them.
Brandie Jenkins, E-learning Developer, USA
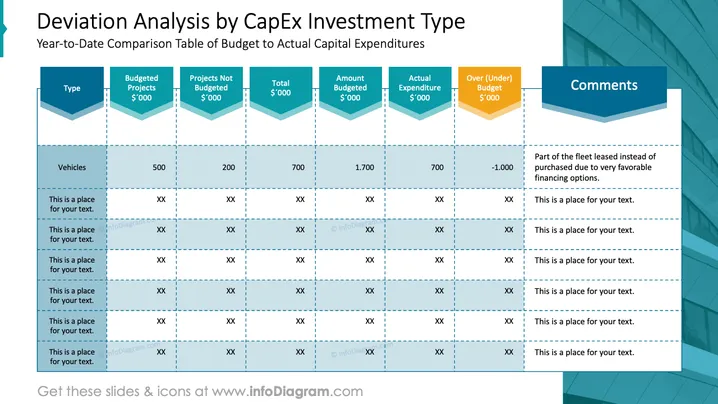
Die Folie ist ein Finanzdiagramm mit dem Titel „Abweichungsanalyse nach CapEx-Investitionstyp“, das eine Vergleichstabelle der Kapitalausgaben (CapEx) vom Budget zum Ist-Stand für das laufende Jahr (Year-to-Date) darstellt. Das Diagramm ist mit den Überschriften „Typ“, „Budgetierte Projekte“, „Nicht budgetierte Projekte“, „Gesamt“, „Budgetierter Betrag“, „Tatsächliche Ausgaben“, „Über (Unter) Budget“ und „Kommentare“ gegliedert. Eine Beispielzeile ist für „Fahrzeuge“ ausgefüllt und zeigt verschiedene Finanzzahlen in Tausendern sowie eine Notiz, die eine Leasingentscheidung aufgrund günstiger Finanzierung erklärt. Die restlichen Zeilen enthalten Platzhalter für Text.
Die Folie verwendet ein professionelles und klares Design mit einem durchgängigen Farbschema. Die Verwendung von Grafiken ist minimal und konzentriert sich auf Übersichtlichkeit und gute Lesbarkeit der präsentierten Daten.




