

Your graphics add a nice touch to my presentations and I recently used them for one of my all-hands meetings. Your toolbox adds professionalism to my slides. Instead of using standard clipart.
Claude Jones, Director of Engineer, @Walmartlabs, USA

Your graphics add a nice touch to my presentations and I recently used them for one of my all-hands meetings. Your toolbox adds professionalism to my slides. Instead of using standard clipart.
Claude Jones, Director of Engineer, @Walmartlabs, USA
I needed a fresh look at some of my slides. I've tried to find a way to create a paintbrush effect, to underline, accentuate, add some color and the handwritten markers were just the things. Very easy to use, easy to size, change the color. It was an affordable, perfect solution and I'm happy to recommend it.
Anonymous, US
The crisp, clean look of the graphics, and the fact that it allowed me to easily edit and change the colors to match the template was my main reason for purchasing them.
Brandie Jenkins, E-learning Developer, USA
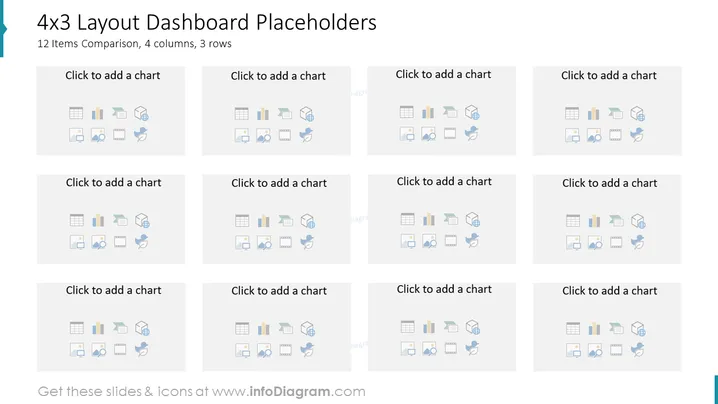
Die Folie mit dem Titel "4x3 Layout Dashboard Platzhalter" ist für den Vergleich von 12 Elementen über 4 Spalten und 3 Zeilen konzipiert. Jede Platzhalterbox enthält den Text "Klicken Sie, um ein Diagramm hinzuzufügen" und wird von einer Reihe verschiedener Diagramm- und Grafiksymbole begleitet, die die Art der Datenvisualisierung vorschlagen, die dort platziert werden könnte. Diese Symbole umfassen Balkendiagramme, Liniendiagramme, Kuchendiagramme, Streudiagramme und Diagramme, die gängige Methoden zur Darstellung von Daten in einem visuell verdaulichen Format darstellen.
Der Gesamteindruck der Folie ist professionell und organisiert und richtet sich nach einer Unternehmens- oder Geschäftsästhetik. Sie ist so gestaltet, dass sie interaktiv ist und Funktionalität anzeigt, wo Diagramme und Grafiken zur Datenrepräsentation eingefügt werden können.



