Your graphics add a nice touch to my presentations and I recently used them for one of my all-hands meetings. Your toolbox adds professionalism to my slides. Instead of using standard clipart.
Claude Jones, Director of Engineer, @Walmartlabs, USA
Your graphics add a nice touch to my presentations and I recently used them for one of my all-hands meetings. Your toolbox adds professionalism to my slides. Instead of using standard clipart.
Claude Jones, Director of Engineer, @Walmartlabs, USA
I needed a fresh look at some of my slides. I've tried to find a way to create a paintbrush effect, to underline, accentuate, add some color and the handwritten markers were just the things. Very easy to use, easy to size, change the color. It was an affordable, perfect solution and I'm happy to recommend it.
Anonymous, US
The crisp, clean look of the graphics, and the fact that it allowed me to easily edit and change the colors to match the template was my main reason for purchasing them.
Brandie Jenkins, E-learning Developer, USA
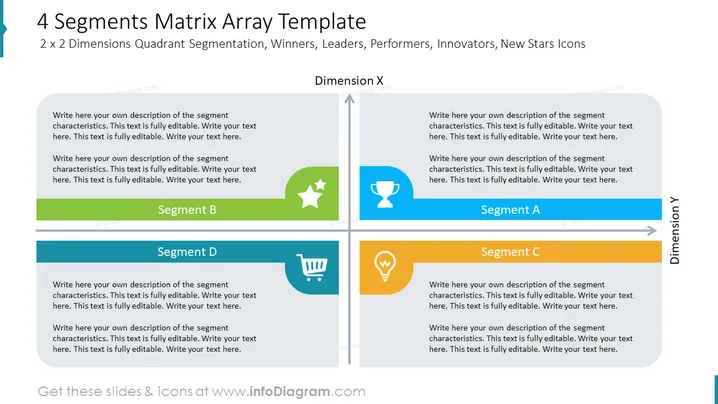
Die Folie ist so gestaltet, dass sie ein Matrix-Array im 2 x 2-Format präsentiert und eine Quadranten-Segmentierung mit zugehörigen Symbolen demonstriert. Sie unterteilt Kategorien entlang zweier Dimensionen, die als Dimension X und Dimension Y bezeichnet sind, wobei jeder Quadrant einen Platzhaltertext und ein einzigartiges Symbol enthält, das einen bestimmten Segmente-Typ symbolisiert: Segment A hat ein Glühbirnen-Symbol, Segment B einen Stern, Segment C einen Pokal und Segment D einen Einkaufswagen. Diese Symbole deuten auf einen Fokus auf Ideen oder Innovation (Glühbirne), Erfolg oder Qualität (Stern), Wettbewerb oder Leistung (Pokal) und Handel oder Verbraucher Verhalten (Einkaufswagen) hin.
Das gesamte Layout ist sauber und professionell und verwendet ein einfaches Design, das hilft, den konzeptionellen Rahmen mit klaren visuellen Elementen zu veranschaulichen.


