

Your graphics add a nice touch to my presentations and I recently used them for one of my all-hands meetings. Your toolbox adds professionalism to my slides. Instead of using standard clipart.
Claude Jones, Director of Engineer, @Walmartlabs, USA

Your graphics add a nice touch to my presentations and I recently used them for one of my all-hands meetings. Your toolbox adds professionalism to my slides. Instead of using standard clipart.
Claude Jones, Director of Engineer, @Walmartlabs, USA
I needed a fresh look at some of my slides. I've tried to find a way to create a paintbrush effect, to underline, accentuate, add some color and the handwritten markers were just the things. Very easy to use, easy to size, change the color. It was an affordable, perfect solution and I'm happy to recommend it.
Anonymous, US
The crisp, clean look of the graphics, and the fact that it allowed me to easily edit and change the colors to match the template was my main reason for purchasing them.
Brandie Jenkins, E-learning Developer, USA
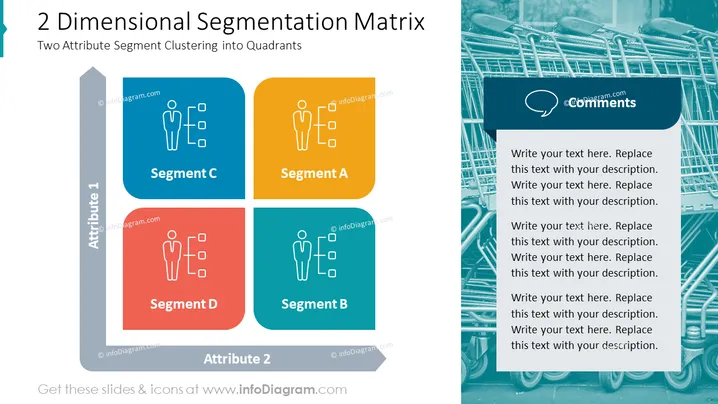
Die Folie mit dem Titel "2-Dimensionale Segmentierungs-Matrix" beschäftigt sich mit dem Konzept der Clusterung von Merkmalen in Quadranten. Segment A stellt eine Gruppe mit hohen Werten für sowohl Merkmal 1 als auch Merkmal 2 dar, was auf ein wünschenswertes oder hochwertiges Segment hindeutet. Segment B könnte einen niedrigeren Wert für Merkmal 1 darstellen, aber immer noch hoch bei Merkmal 2, was auf ein potenziell wachsendes oder gezieltes Segment hinweisen könnte. Segment C kann hohe Werte für Merkmal 1, aber niedrige Werte für Merkmal 2 zeigen, vielleicht ein Segment, das in einem Aspekt stark, aber in einem anderen schwächer ist. Schließlich repräsentiert Segment D niedrige Werte in beiden Merkmalen, die normalerweise als das am wenigsten wünschenswerte Segment angesehen werden.



