

Your graphics add a nice touch to my presentations and I recently used them for one of my all-hands meetings. Your toolbox adds professionalism to my slides. Instead of using standard clipart.
Claude Jones, Director of Engineer, @Walmartlabs, USA

Your graphics add a nice touch to my presentations and I recently used them for one of my all-hands meetings. Your toolbox adds professionalism to my slides. Instead of using standard clipart.
Claude Jones, Director of Engineer, @Walmartlabs, USA
I needed a fresh look at some of my slides. I've tried to find a way to create a paintbrush effect, to underline, accentuate, add some color and the handwritten markers were just the things. Very easy to use, easy to size, change the color. It was an affordable, perfect solution and I'm happy to recommend it.
Anonymous, US
The crisp, clean look of the graphics, and the fact that it allowed me to easily edit and change the colors to match the template was my main reason for purchasing them.
Brandie Jenkins, E-learning Developer, USA
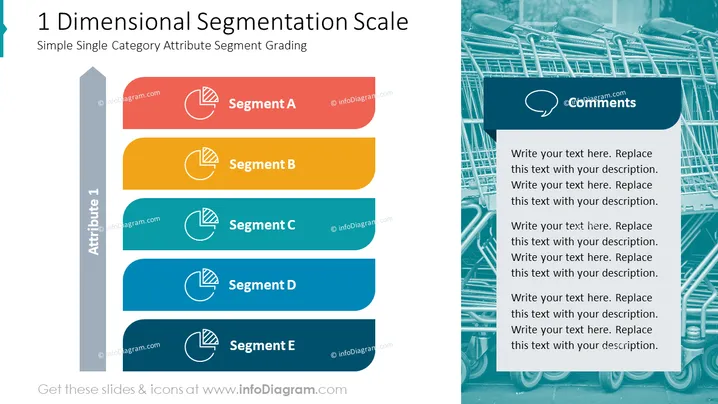
Die Folie präsentiert ein Konzept namens "1 Dimensionales Segmentierungsschema", das als einfaches Bewertungssystem für Attribute innerhalb einer Kategorie beschrieben wird. Es verfügt über eine segmentierte Pfeilgrafik mit fünf Segmenten, die von A bis E markiert sind und verschiedene Ebenen oder Kategorien innerhalb eines einzelnen Attributs darstellen. Jedes Segment enthält ein ikonisches Symbol, das einem Tortendiagramm ähnelt und anscheinend einen Teil oder einen Bruchteil darstellt, der möglicherweise eine quantifizierbare Messung anzeigt.
Die Farbpalette der Folie umfasst gedämpfte und tiefe Töne, die visuelle Unterscheidung zwischen Segmenten ermöglichen, während die Icons thematische Konsistenz bieten. Das Design ist ausgewogen, mit einem klaren Fokus auf dem segmentierten Schema auf der linken Seite und Raum für ergänzenden Text auf der rechten Seite, was eine funktionale und visuell ansprechende Komposition schafft.



