Präsentieren Sie über nachhaltige Wertschöpfungsketten, Ressourceneffizienz oder Abfallreduzierung? Nutzen Sie unser vorgefertigtes Sustainable Development Goals SDG 12 Responsible Consumption and Production Deck, das wichtige Ziele, Indikatoren und Leistungsvisualisierungen klar darstellt.
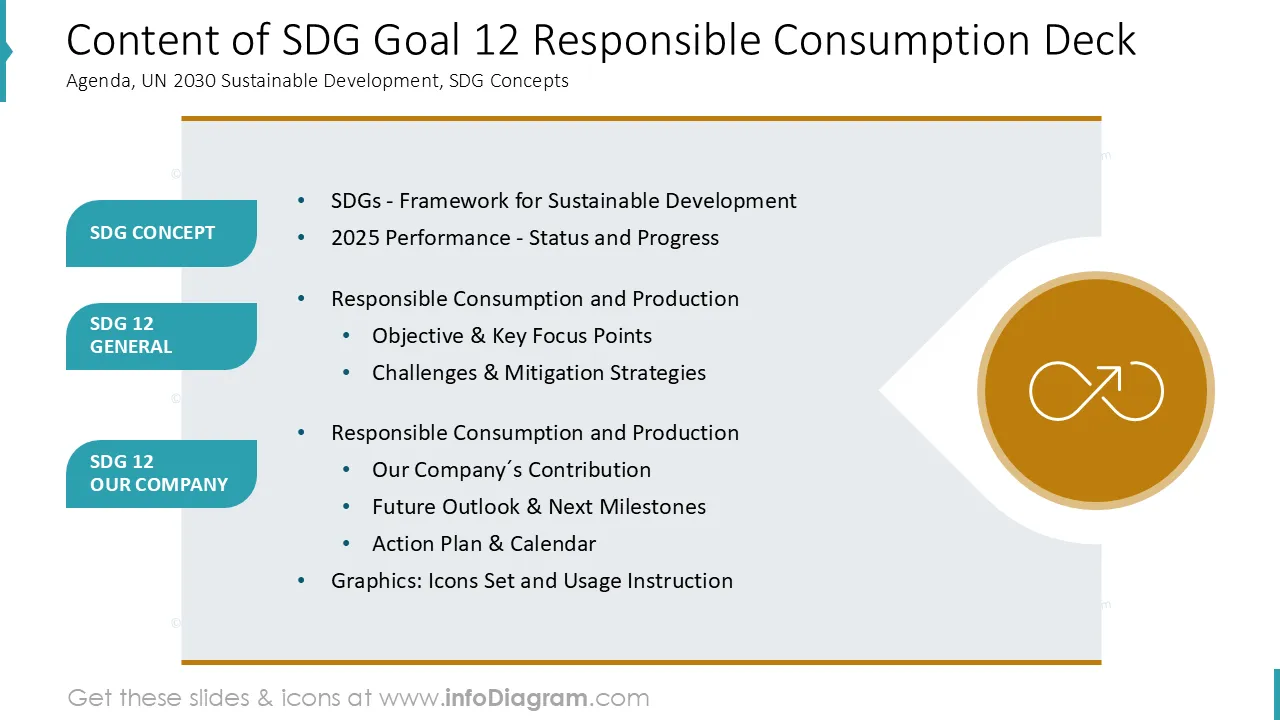
Diese SDG 12 PowerPoint-Vorlage enthält:
- 18 Layouts mit Diagrammen, Tabellen und Grafiken, die Themen wie nachhaltigen Verbrauch, Produktionsabfallmanagement, Kreislaufwirtschaft und Lieferkette veranschaulichen.
- Mehr als 30 Icons, die Nachhaltigkeitsthemen, die 17 SDG-Ziele, Arbeit, Wirtschaft, Leistung, Finanzen, Plan, Strategie, Menschen, saubere Energie oder andere allgemeine Geschäftskonzepte veranschaulichen
- Anleitung zum Ändern dieser Diagramme mit Standard-PowerPoint-Bearbeitungswerkzeugen.
Dieses PowerPoint-Foliendeck ist in einem professionellen Stil mit farbenfrohen Vektorgrafiken und Liniensymbolen gestaltet. Alle grafischen Formen können ohne Qualitätsverlust neu eingefärbt und in der Größe geändert werden.
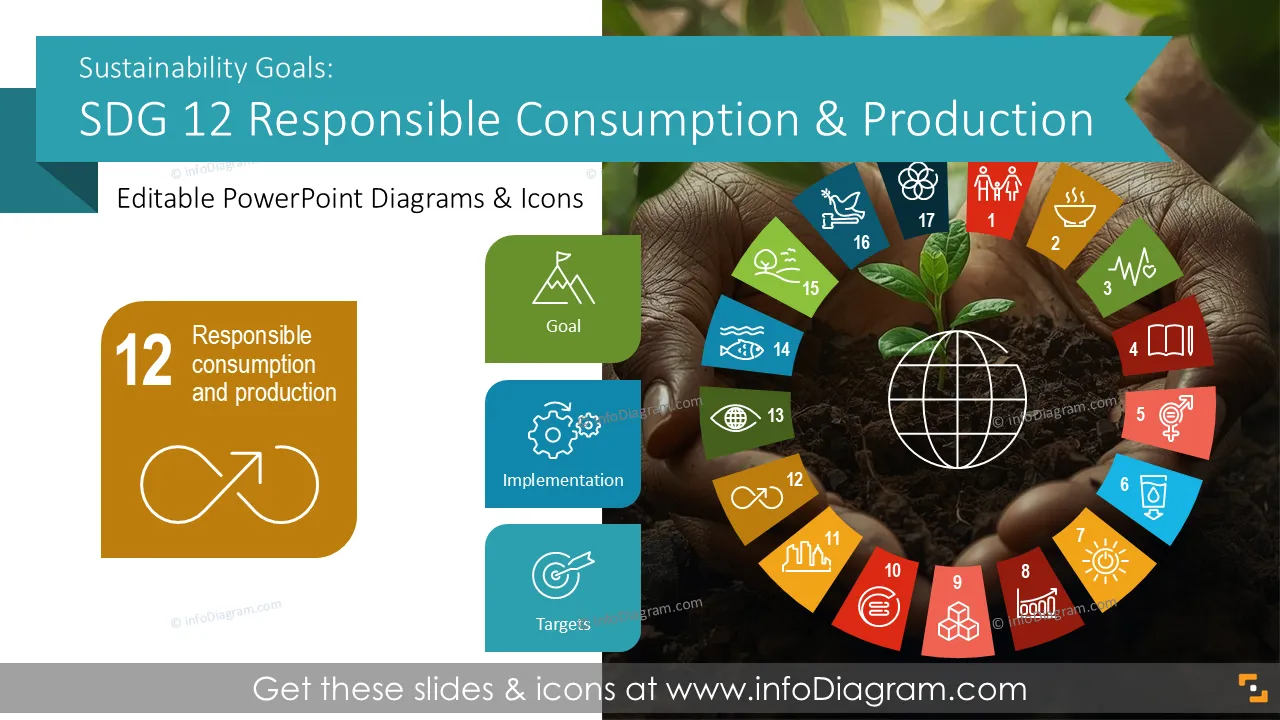
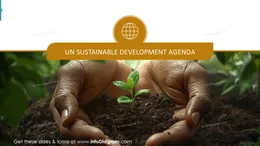
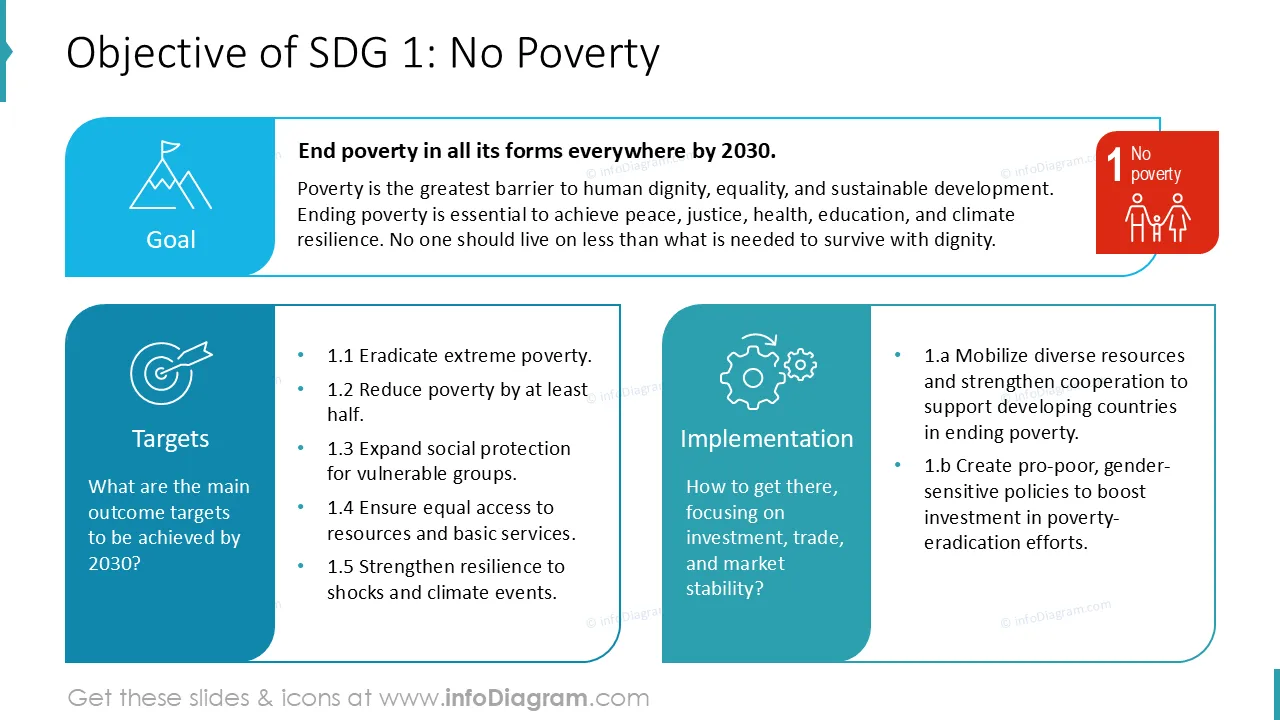
Worum geht es bei dem UN-Ziel SDG 12 Verantwortungsbewusster Konsum und Produktion?
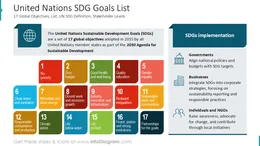
SDG 12 ist ein Ziel der Vereinten Nationen für nachhaltige Entwicklung, das sich auf die Sicherstellung nachhaltiger Konsum- und Produktionsmuster konzentriert. Es befasst sich mit Ressourcennutzung, Abfallmanagement, Praktiken der Kreislaufwirtschaft und der Verantwortung in der Lieferkette.
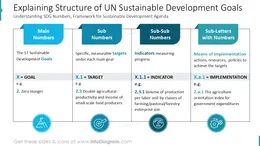
SDG 12 bietet einen gemeinsamen Rahmen zur Verfolgung der Konsum- und Produktionsleistung durch definierte Ziele und Indikatoren.
Warum einen visuellen Weg zur Präsentation von SDG 12 Verantwortungsbewusster Konsum und Produktion wählen?
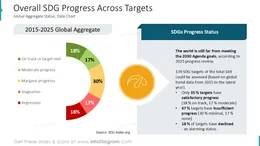
Konsum- und Produktionsthemen umfassen oft komplexe Prozesse und mehrere Datenpunkte. Visuelle Folien helfen, Material-, Ressourcen- und Abfallströme zu vereinfachen.
Zum Beispiel die Verwendung von Flussdiagrammen oder Tabellen zur Präsentation von KPI-Maßnahmen für Effizienzsteigerungen, Reduzierungen und Trends, die leicht verständlich sind. Gut strukturierte Layouts helfen bei der klaren Kommunikation von Nachhaltigkeitskonzepten.
Diese vorgefertigten SDG PowerPoint-Vorlagen ermöglichen es Ihnen, unsere Illustrationen wiederzuverwenden. Alle Formen und Texte sind editierbar. Wir haben auch Anweisungen zum Bearbeiten von Farben und Stil beigefügt.
Wie können Sie die SDG 12 Verantwortungsbewusster Konsum und Produktion PPT-Vorlage verwenden?
Sehen Sie Beispiele, wo Sie diese SDG-Präsentation verwenden können, um einen fairen Ansatz für Konsum und Produktion zu kommunizieren:
- Stellen Sie die SDG 12-Ziele, -Vorgaben und -Indikatoren in einem prägnanten Überblick vor
- Visualisieren Sie Ressourcennutzung, Abfall und Effizienz-KPIs
- Präsentieren Sie Initiativen zur Kreislaufwirtschaft, zum Recycling und zur Reduzierung
- Vergleichen Sie die Leistung über Produkte, Standorte oder Zeiträume hinweg
- Heben Sie Risiken, Lücken und Prioritätsmaßnahmen mit visuellen Statusmarkern hervor
- Unterstützen Sie ESG- und Nachhaltigkeitsberichte, ob im Folienformat oder in anderen schriftlichen Dokumenten – Sie können diese Diagramme und Tabellen auch wiederverwenden, wenn Sie sie in MS Word oder andere Dokumentformate kopieren
Alle Grafiken sind bearbeitbar, um Größe, Farben und Text zu ändern. Zusätzlich können Sie die Sammlung mit weiteren PPT-Symbolen erweitern (siehe Abschnitt „Verwandte Diagramme“).
Sie können alle Elemente einfach ändern:
- Symbole ersetzen
- Füll- und Umrissfarbe ändern
- Größe und Proportionen ändern
- Drehen, spiegeln, ausrichten und Reihenfolge ändern
Autoren dieser SDG-Präsentationsvorlage