Your graphics add a nice touch to my presentations and I recently used them for one of my all-hands meetings. Your toolbox adds professionalism to my slides. Instead of using standard clipart.
Claude Jones, Director of Engineer, @Walmartlabs, USA
Your graphics add a nice touch to my presentations and I recently used them for one of my all-hands meetings. Your toolbox adds professionalism to my slides. Instead of using standard clipart.
Claude Jones, Director of Engineer, @Walmartlabs, USA
I needed a fresh look at some of my slides. I've tried to find a way to create a paintbrush effect, to underline, accentuate, add some color and the handwritten markers were just the things. Very easy to use, easy to size, change the color. It was an affordable, perfect solution and I'm happy to recommend it.
Anonymous, US
The crisp, clean look of the graphics, and the fact that it allowed me to easily edit and change the colors to match the template was my main reason for purchasing them.
Brandie Jenkins, E-learning Developer, USA
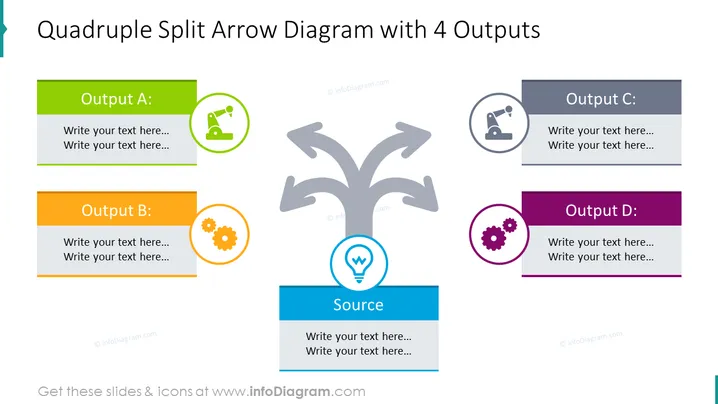
The slide represents a "Quadruple Split Arrow Diagram with 4 Outputs," illustrating how a single source can lead to four different outputs labeled A, B, C, and D. Each output is accompanied by space for a text description and is marked by unique colors and icons signifying different processes or results. Output A and Output C seem to focus on industrial or mechanical themes based on their icons, while Output B is related to settings or operational work, and Output D is connected to technical or engineering tasks.
The slide is visually balanced with a central focal point and graphics that guide the viewer's eye outward, suggesting a flow from the center to the periphery. The use of distinctive colors and icons efficiently represents varied outputs or categories linked to a common source.


