Your graphics add a nice touch to my presentations and I recently used them for one of my all-hands meetings. Your toolbox adds professionalism to my slides. Instead of using standard clipart.
Claude Jones, Director of Engineer, @Walmartlabs, USA
Your graphics add a nice touch to my presentations and I recently used them for one of my all-hands meetings. Your toolbox adds professionalism to my slides. Instead of using standard clipart.
Claude Jones, Director of Engineer, @Walmartlabs, USA
I needed a fresh look at some of my slides. I've tried to find a way to create a paintbrush effect, to underline, accentuate, add some color and the handwritten markers were just the things. Very easy to use, easy to size, change the color. It was an affordable, perfect solution and I'm happy to recommend it.
Anonymous, US
The crisp, clean look of the graphics, and the fact that it allowed me to easily edit and change the colors to match the template was my main reason for purchasing them.
Brandie Jenkins, E-learning Developer, USA
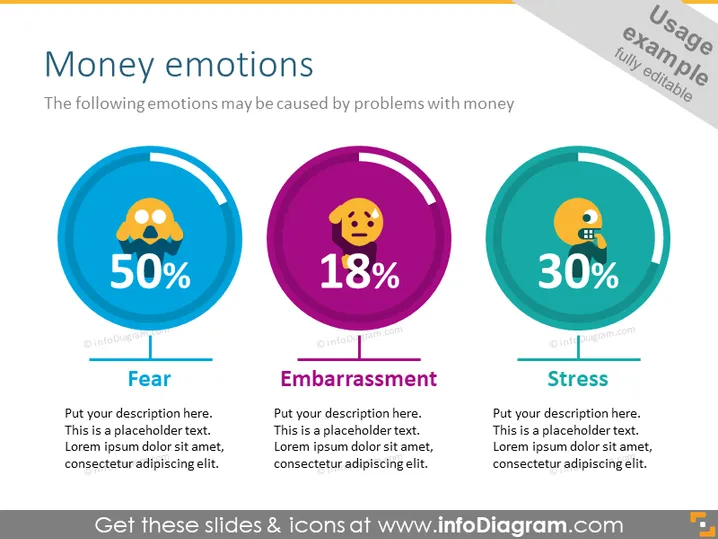
The slide is titled "Money emotions" and details how certain emotions can be caused by problems with money. It features three colored circular graphics, each depicting a different emotion and its corresponding percentage, which can be assumed to represent the prevalence or intensity of that emotion in relation to money issues. The emotions listed are "Fear" at 50%, "Embarrassment" at 18%, and "Stress" at 30%. Under each graphic, there is a placeholder for additional descriptions that reads "Put your description here. This is a placeholder text. Lorem ipsum dolor sit amet, consectetur adipiscing elit."
The overall look of the slide is clean, colorful, and easy to comprehend with a strong visual hierarchy that guides the viewer's attention from the title to the graphics and their corresponding descriptions. The color-coding and icons used in the circles are effective in conveying different emotional states associated with financial issues.


