Financial Decks
Visualize your results with ease
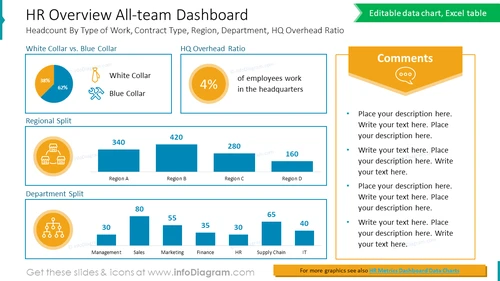
HR Overview All-team Dashboard
from deck
Company Town Hall Meeting Presentation (PPT Template)
Info
HR Overview All-team Dashboard
Slide Content:
- Headcount by type of work: This shows the percentage of employees who work in white-collar versus blue-collar jobs. (White-collar: 62%, Blue-collar: 38%)
- HQ overhead ratio: This shows the percentage of employees who work in the headquarters. (4%)
- Regional split: This shows the number of employees in each region. (Region A: 340, Region B: 420, Region C: 280, Region D: 160)
- Department split: This shows the number of employees in each department. (Management: 80, Sales: 30, Marketing: 55, Finance: 65, HR: 35, Supply Chain: 30, IT: 40)
Graphical Look:
- The slide has a simple and clean design.
- The chart shows the headcount by type of work and the HQ overhead ratio.
- The table shows the regional split and department split.
- The slide also includes a few icons to illustrate the different HR concepts.
Overall, the slide is a well-designed and informative dashboard that provides a snapshot of the company's HR data.
Use Cases
This slide can be used in a variety of business presentations, such as:
- Executive presentations: This slide can be used to give executives a quick overview of the company's HR data.
- Board meetings: This slide can be used to present the HR data to the board of directors.
- Investor presentations: This slide can be used to present the HR data to potential investors.
- HR team presentations: This slide can be used by the HR team to present their data to the rest of the company.
- Sales presentations: This slide can be used by sales teams to show potential customers how the company is investing in its people.


