Your graphics add a nice touch to my presentations and I recently used them for one of my all-hands meetings. Your toolbox adds professionalism to my slides. Instead of using standard clipart.
Claude Jones, Director of Engineer, @Walmartlabs, USA
Your graphics add a nice touch to my presentations and I recently used them for one of my all-hands meetings. Your toolbox adds professionalism to my slides. Instead of using standard clipart.
Claude Jones, Director of Engineer, @Walmartlabs, USA
I needed a fresh look at some of my slides. I've tried to find a way to create a paintbrush effect, to underline, accentuate, add some color and the handwritten markers were just the things. Very easy to use, easy to size, change the color. It was an affordable, perfect solution and I'm happy to recommend it.
Anonymous, US
The crisp, clean look of the graphics, and the fact that it allowed me to easily edit and change the colors to match the template was my main reason for purchasing them.
Brandie Jenkins, E-learning Developer, USA
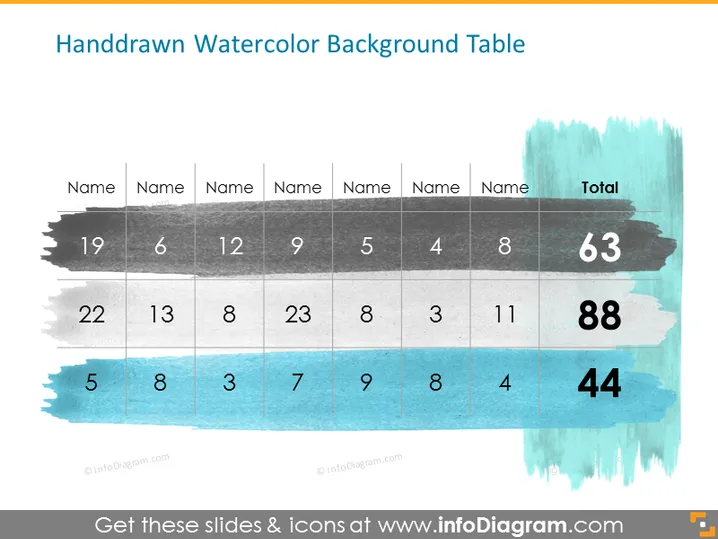
The slide presents a colorful table with a handdrawn watercolor background. The table is organized into three rows and eight columns. The header row contains the word "Name" repeated seven times along with a column titled "Total", suggesting this is a generic layout for various data entries. Each subsequent row contains numerical values with a total summation at the end. The numbers in the rows seem arbitrary and are likely placeholders, with totals being 63, 88, and 44 respectively.
The overall look of the slide is artistic and engaging, with a creative twist on a standard data table presentation. The handdrawn, watercolor effects add a casual yet aesthetically pleasing element to an otherwise standard table visual.


