Your graphics add a nice touch to my presentations and I recently used them for one of my all-hands meetings. Your toolbox adds professionalism to my slides. Instead of using standard clipart.
Claude Jones, Director of Engineer, @Walmartlabs, USA
Your graphics add a nice touch to my presentations and I recently used them for one of my all-hands meetings. Your toolbox adds professionalism to my slides. Instead of using standard clipart.
Claude Jones, Director of Engineer, @Walmartlabs, USA
I needed a fresh look at some of my slides. I've tried to find a way to create a paintbrush effect, to underline, accentuate, add some color and the handwritten markers were just the things. Very easy to use, easy to size, change the color. It was an affordable, perfect solution and I'm happy to recommend it.
Anonymous, US
The crisp, clean look of the graphics, and the fact that it allowed me to easily edit and change the colors to match the template was my main reason for purchasing them.
Brandie Jenkins, E-learning Developer, USA
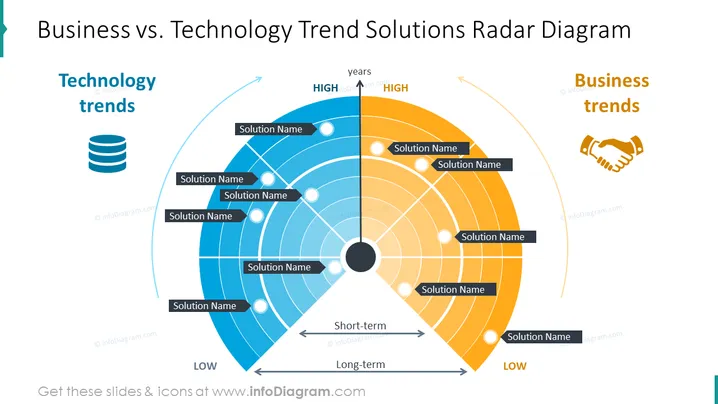
The slide presents a radar diagram comparing Business and Technology trends over time. There are two halves, one for each trend type, with items plotted on a timeline from short-term to long-term. The intensity of each trend is indicated by its proximity to the "HIGH" or "LOW" markers. Each "Solution Name" likely signifies a specific strategic initiative or trend within the business or technology sector that needs to be evaluated for impact and duration.
The slide is visually balanced, with a clear distinction between business and technology sectors through color coding and relevant icons. It's designed to facilitate comparison and trend analysis with a straightforward, visually engaging radar chart.
This slide would be effectively used in strategic planning meetings, technology and business alignment discussions, product development roadmaps, and investment briefings where assessing the relative importance and timing of various trends is crucial.


