Your graphics add a nice touch to my presentations and I recently used them for one of my all-hands meetings. Your toolbox adds professionalism to my slides. Instead of using standard clipart.
Claude Jones, Director of Engineer, @Walmartlabs, USA
Your graphics add a nice touch to my presentations and I recently used them for one of my all-hands meetings. Your toolbox adds professionalism to my slides. Instead of using standard clipart.
Claude Jones, Director of Engineer, @Walmartlabs, USA
I needed a fresh look at some of my slides. I've tried to find a way to create a paintbrush effect, to underline, accentuate, add some color and the handwritten markers were just the things. Very easy to use, easy to size, change the color. It was an affordable, perfect solution and I'm happy to recommend it.
Anonymous, US
The crisp, clean look of the graphics, and the fact that it allowed me to easily edit and change the colors to match the template was my main reason for purchasing them.
Brandie Jenkins, E-learning Developer, USA
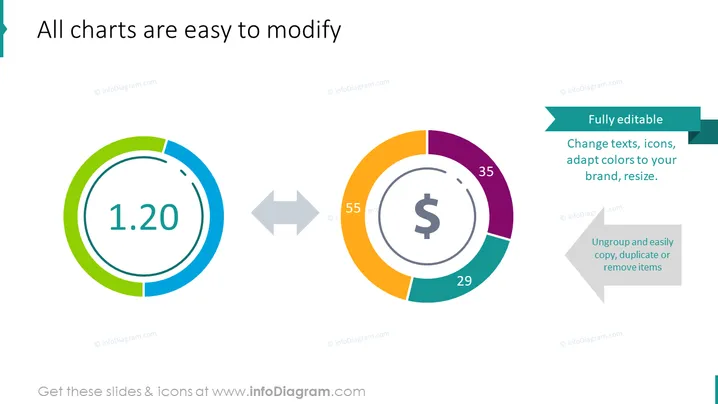
The PowerPoint slide is about customizable charts, demonstrating how easily they can be altered. It features a comparative illustration between two different chart types: the first is a simple numeric indicator chart showing "1.20," and the second is a more complex donut chart with various segments labeled "55," "29," and "35," along with a dollar sign in the center. The graphic suggests a transformation or comparison process, as indicated by the double-sided arrows between the charts. The slide highlights that the charts are fully editable, allowing changes in text, icons, colors, and size, and can be ungrouped for easy copying, duplication, or removal of items.
The overall look of the slide is professional and visually engaging. The color choices are pleasant, and the emphasis is on the ease of editing the chart components.


